

Some stocks don’t have much to brag about over the past couple of years and below we look at one of them!
Mylan (MYL) has had a rough go of it the past two years as it lost nearly 50% of its value. During this decline could a pattern opportunity have formed. Possibly!
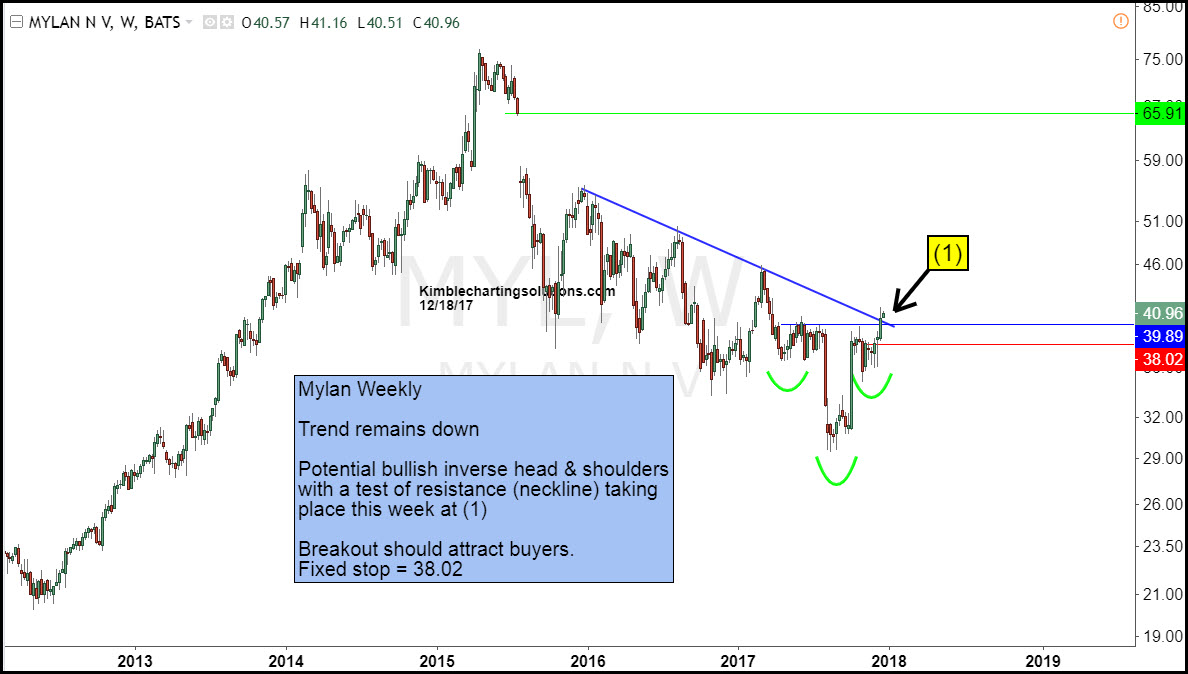
Below looks at MYL over the past 5-years-
CLICK ON CHART TO ENLARGE
Over the past year, MYL could be forming a bullish inverse head & shoulders pattern with a test of the neckline and falling resistance taking place at (1). If a breakout takes place here, it could attract buyers to this hard-hit stock.
Another thing that catches our attention is the large unfilled gap that took place back in 2015 at the $65 zone. Often times “Gaps” end up getting filled. If this gap would get filled, MYL would make some nice gains from current levels.
Full Disclosure- Members are long this stock with a tight stop.
