

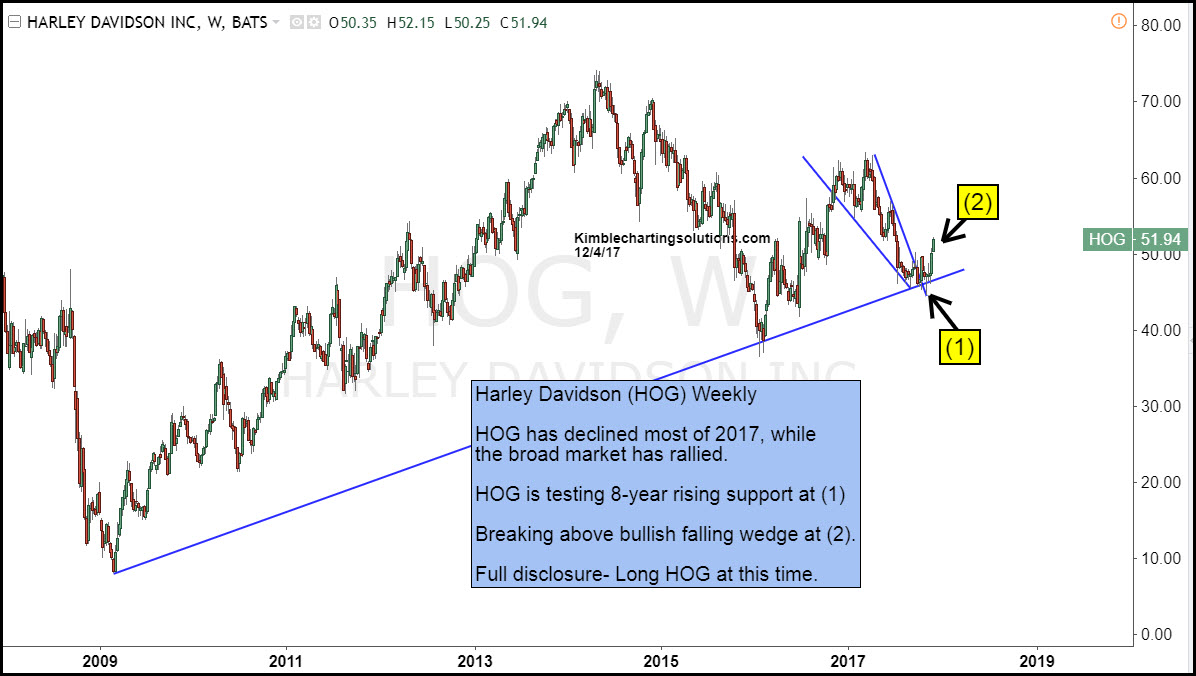
2017 hasn’t been an “easy ride” for Harley Davidson (HOG) as it has declined the majority of the year, while the broad market has power higher.
Below takes a look at HOG over the past 9-years and applies the Power of the Pattern to it-
CLICK ON CHART TO ENLARGE
The 25%+ decline this year in HOG took it down to test 8-year rising support and the bottom of a potential bullish falling wedge pattern at (1).
Since testing dual support at (1), a breakout of the bullish falling wedge is taking place at (2).
Full disclosure- Members bought HOG at is was testing this dual support at (1). This type of set up, a decline that tests long-term support in combo with a bullish falling wedge pattern, continues to provide good risk/reward potential.
