Banks started showing cracks back in 2007 and before long they started breaking support and fell hard.
The current bank trend remains UP at this time. The trend finds itself back at 2007 highs, where bulls would NOT want to see selling pressure start taking place!
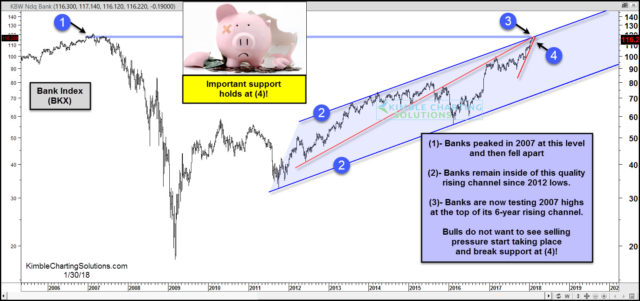
Below looks at the Banks Index (BKX) over the past 15 years-
CLICK ON CHART TO ENLARGE
The Bank Index peaked at (1) back in 2007, before a waterfall pattern started taking place. The index has formed a rising channel (2) over the past 6-years, where it is now testing the 2007 highs at the top of the rising channel at (3).
Bulls do NOT want to see selling pressure start at this key level and have support break at (4). If it does, this key sector could see some selling pressure get started.
Are banks the only important index testing 2007 highs? Nope!
Below looks at the Semiconductor index (SMH)over the past 20-years-
CLICK ON CHART TO ENLARGE
Similar to banks, the Semiconductor index is testing an important high from its past, where it started falling apart! SMH is now testing 2000 highs at the top of rising channel (2) at (3).
The trends for Banks and Semiconductors both remain up at this time and if they can breakout above 20007 and 2000 highs, would send a continuing bullish message.
With Banks testing 2007 highs and Semiconductors are testing 2000 highs, rising trends could get disrupted if rising support at each (4) would be broken to the downside.


