

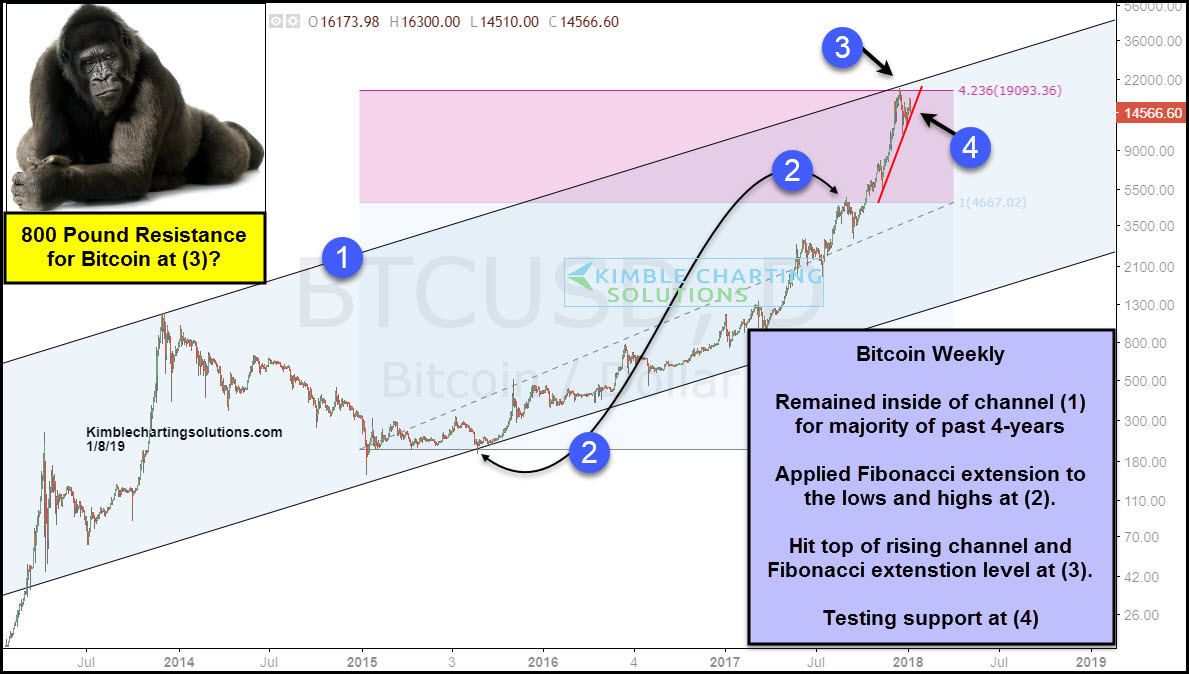
Below looks at a weekly chart of Bitcoin back to 2013. Bitcoin has spent the majority of the past 4-years inside of rising channel (1), where the top of it was hit at (3) in mid-December, three weeks ago. At this time the trend remains up.
CLICK ON CHART TO ENLARGE
The Power of the Pattern applied Fibonacci to the lows and highs at each (2). The steep rally in bitcoin off the highs at (2), saw it hit the top of the rising channel and its Fibonacci 423% extension level at (3), where a large bearish reversal pattern took place.
Until it breaks out, could this be an important 800-Pound resistance test for Bitcoin at (3)? The Power of the Pattern thinks so.
Bitcoin bulls might want to watch rising support at (4), as this is a key test of the sharp rally of late. If this support breaks, it would increase the odds that the 800-pound resistance zone is something of importance to the bulls.
