
CLICK ON CHART TO ENLARGE
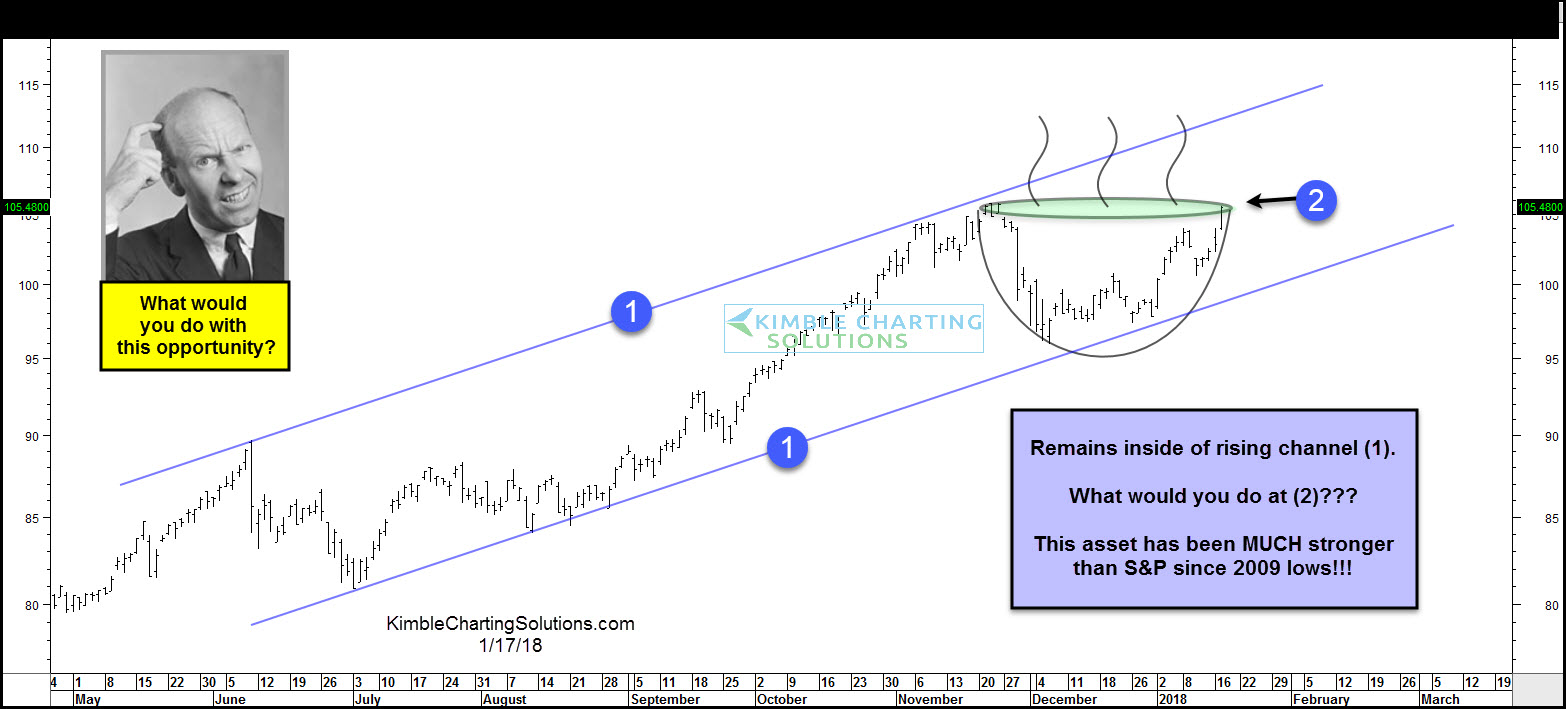
This chart looks at an asset that remains inside of 8-month rising channel (1). It had been weak of late, where it tested rising support at the start of this year.
This asset has “Doubled” the S&P 500 since the lows of 2009, reflecting that it remains a leader.
It looks to be testing the top of a potential bullish cup & handle pattern at (2).
What would you do with this opportunity?
Please feel free to share what you would do with this pattern by sending and email to [email protected]. If you would like to know what this asset is, send an email asking for the answer to the “1/17/18” Quiz.
