CLICK ON CHART TO ENLARGE
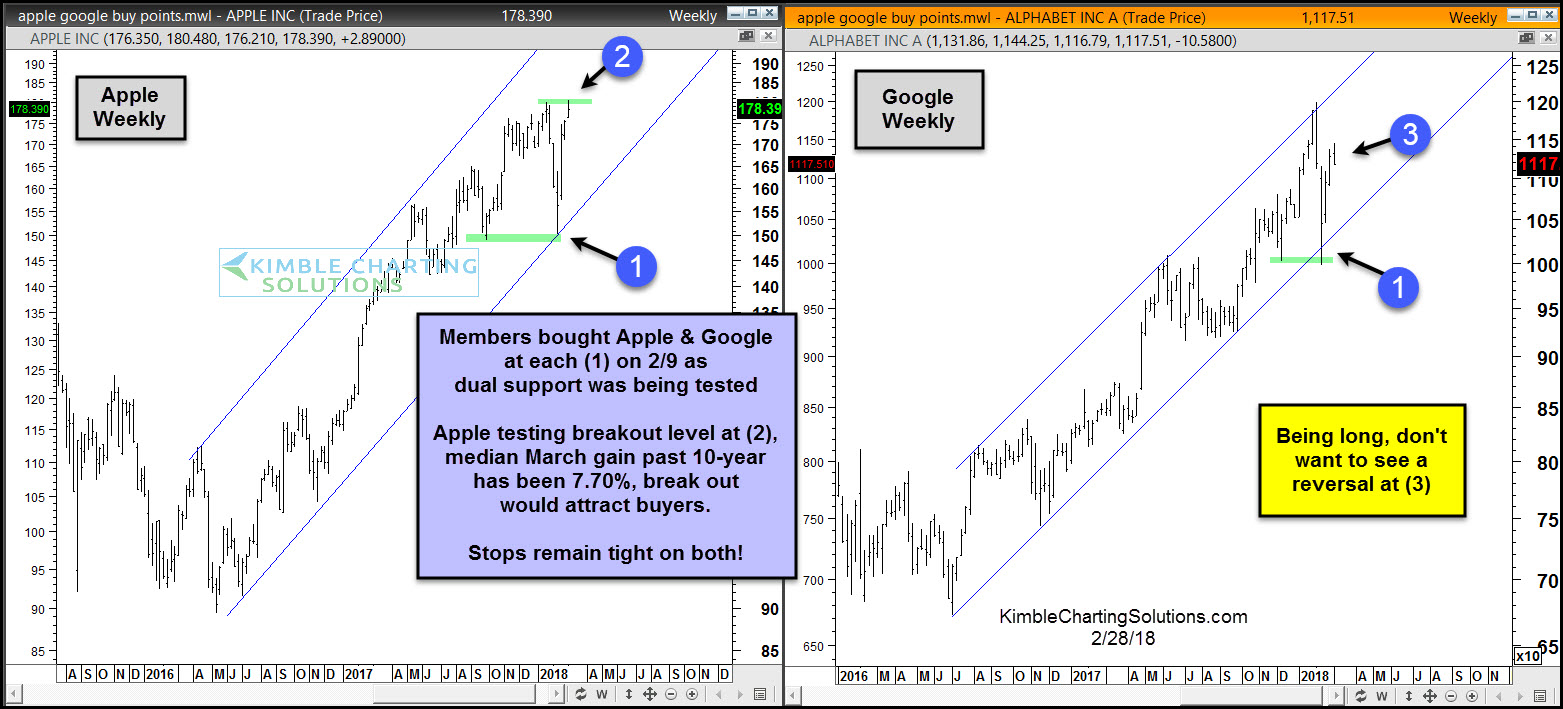
Wanted to update viewers on the patterns Apple & Google are making. As mentioned above, members purchased both on Friday, February the 2nd, as dual support was being tested at each (1). Both have rallied nicely and reflected a good deal more relative strength over the broad market since buying (Apple over twice as strong as S&P since purchase).
Each month we share with members the top 20 S&P 500 stocks that have done well each calendar month over the prior decade. Over the past 10-years during the month of March, Apple’s median gain has been 7.70%, as it has rallied 8 out of the past 10-years. Apple is now testing all-time highs at (2) above. If it would breakout at (2), heading into the historically strong month of March, it could attract buyers and push it higher.
Google has been doing well, just not quite as strong as Apple, since the purchase on 2/9. Stops on both stocks remain tight. The first two days of the week, Google appears to be creating a reversal pattern at (3). What will be most important for it pattern wise, is the weekly close!
View our most recent webinar multi-decade patterns in play and how to take advantage