
CLICK ON CHART TO ENLARGE
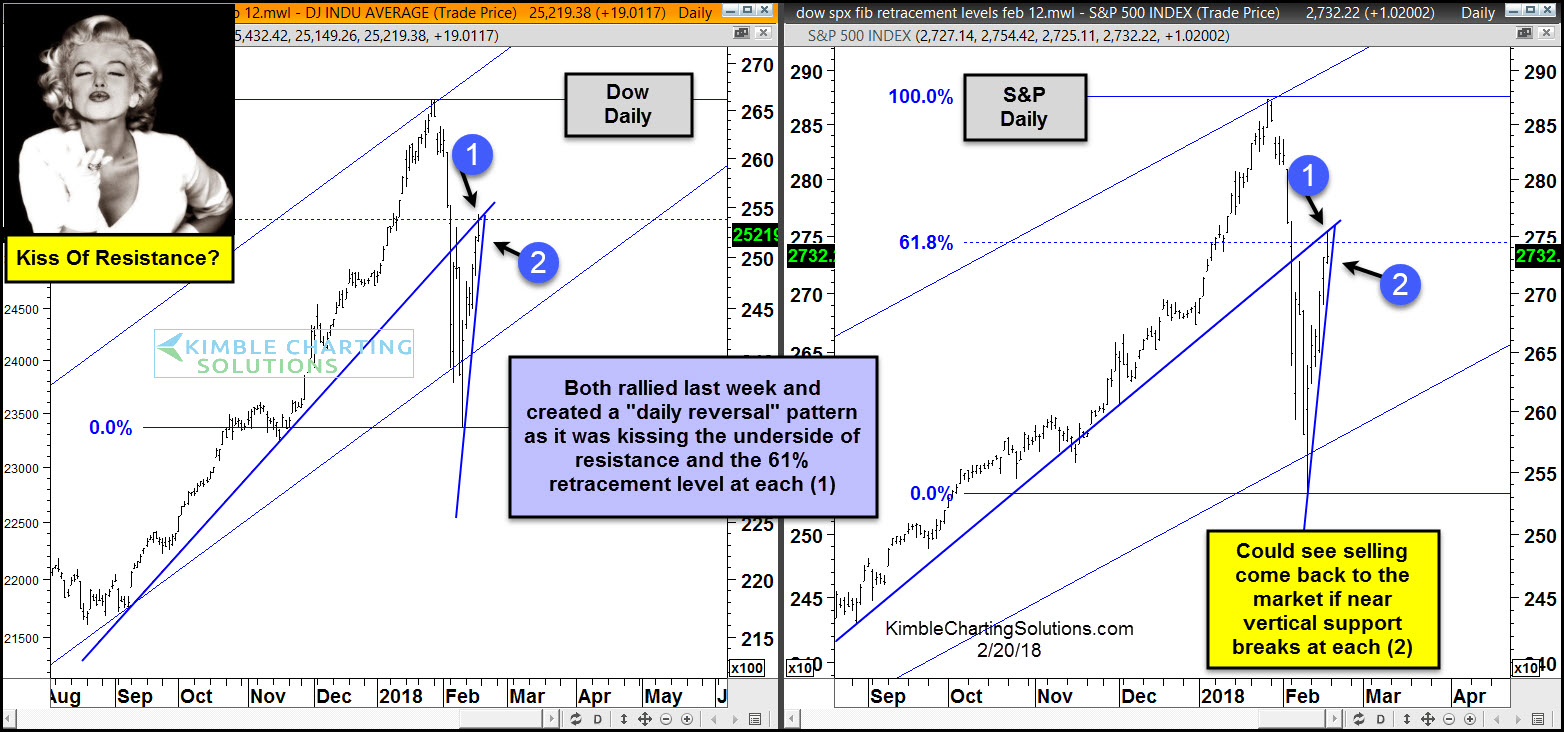
The 2-pack above highlights that the Dow and S&P 500 remain inside of rising channels as the recent declines hit the bottom of the channels and bullish reversals took place. Short-term positive action by these key indices sent a positive signal to do some bottom fishing after the quick 10% decline around 7 business days ago (2/9). The rally since 2/9 has both of them testing respective 61% retracement levels while kissing the underside of what used to be rising support as new resistance at each (1).
It is important for both in the short-term that steep rising support holds at (2).
Below updates the charts on Apple & Google we have been updating since letting blog viewers aware of members purchase-
CLICK ON CHART TO ENLARGE
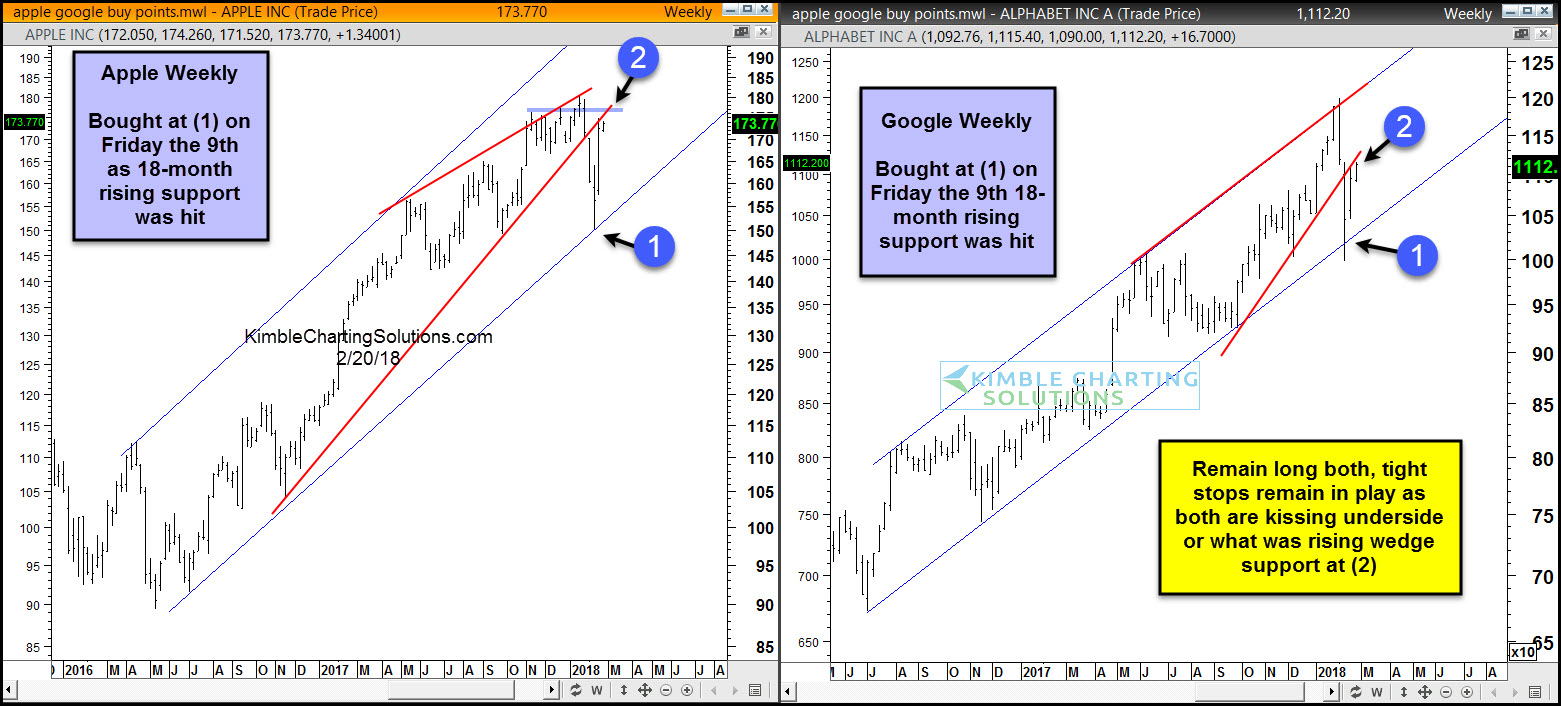
Bought each as they were hitting 15-month rising channels at each (1). The rally since the purchase on Friday the 9th now has each of them kissing the underside of what you to be rising wedge support at each (2).
With the Dow, S&P, Apple & Google all kissing the underside of what was old support (become new Short-term resistance test) members are remaining long with stops rather tight as the short-term kiss tests are in play. Both positions are now up over 10% and unless stops are hit, have no intention of selling either of them at this time.
Tomorrow we will be conducting a private briefing for our blog viewers and these charts will be two of many that we will discuss. We will discuss how to play breakout/breakdowns in Gold, US$ and the Euro. If you would like to attend our FREE webinar….CLICK HERE TO REGISTER

