One of Mark Twain’s famous quotes is “The reports of my death have been greatly exaggerated.” It’s very easy to find people saying the death of the 25-year bond market has already taken place. Has the death of the bond bull actually happened?
No doubt rates have blasted off, as we shared they are up 110% in the past 84-weeks, which was the strongest 84-week rally in 30-years. SEE POST HERE.
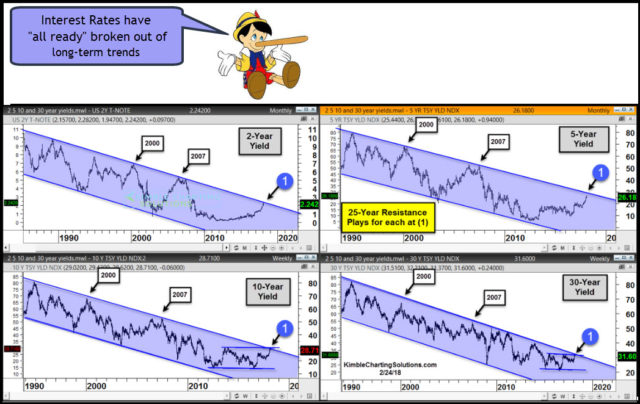
Did the sharp rally cause 2-year, 5-year, 10-year & 30-year yields to break out above 25-year falling channels and put an end to the multi-decade bear market? I will let the 4-pack below speak for itself.
CLICK ON CHART TO ENLARGE
Yields in each of the charts above reflect that sharp rallies have taken place for sure, yet “breakouts of the long-term trends have not taken place at each (1).” The yields 10 and 30-year yields haven’t even broken out of 5-year trading ranges!
The last two times that “Each” of these came near or touched the top of the falling channels, was back in 2000 & 2007. We are not saying that breaks cannot or will not take place, we are just letting the chart empower you to the fact that long-term breakouts have not taken place so far.
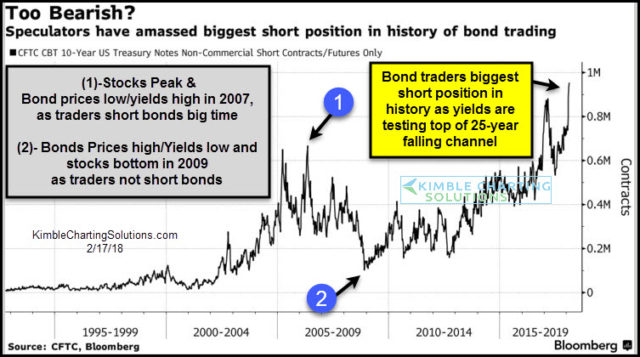
The rally in yields has created a very crowded trade in the bond pits as traders have amassed the largest short position ever, as the belief that the bond bull market is over.
CLICK ON CHART TO ENLARGE
Until recently the last time traders established the largest short position in bond history was back at (1), which was 2007, which was the last time yields hit the top of the 25-year falling channel. As yields are at the top of 25-year falling resistance if rates would happen to start falling, could a short covering rally in bonds take place? Possible!
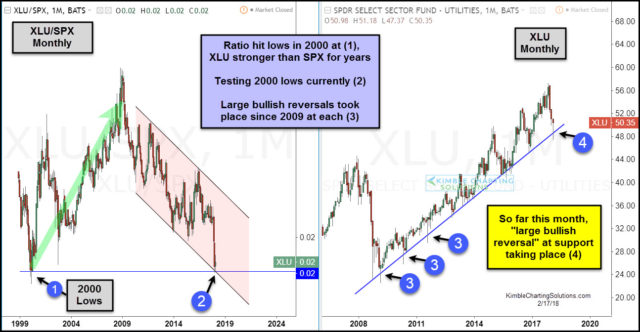
The sharp rally in yields has caused interest rate sensitive assets like Govt bonds, Utilities, and Real Estate to fall in price and greatly underperform stocks by a large percentage. Could the historical rally in yields be creating opportunities in rate sensitive assets? Possible, check out below.
CLICK ON CHART TO ENLARGE
The rally in yields has the XLU/SPX ratio testing the lows in 2000 at (2). The last time the ratio was this low, XLU reflected relative strength compared to the S&P for years to come, starting in 2000. The decline in XLU currently has it testing 9-year rising support at (4), where so far this month it has created one of the largest bullish reversal patterns in the past 7-years.
The death of the 25-year is being tested in yields in the top 4-pack. If yields rally much more, breakouts in all of them will take place. If rates do breakout in each, odds are they could push higher and stronger than what we have seen of late.
The last two times yields hit the top of falling channel was back in 2000 & 2007. Will it be different this time??? If it isn’t different this time, could it impact stocks?
I am of the opinion that “Multi-Decade Opportunities” are in play in Bonds/Yields, Stocks, and Commodities (Gold, Silver, Copper & Miners). Due to these important opportunities, we produced a FREE webinar this week and offered $45,000 of bonus research to new members.
To see webinar and free research offer to new members, which is still in play…CLICK HERE
To watch the webinar only CLICK HERE


