

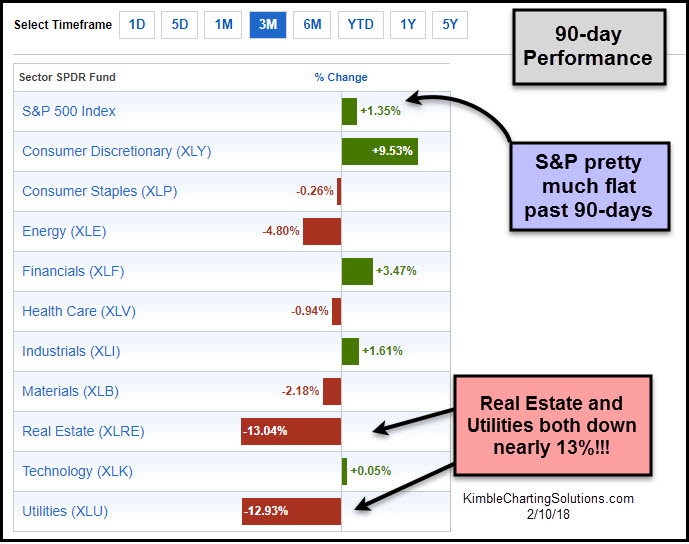
Market declines and under performance can create opportunities. The table below looks at performance of the S&P 500 sectors over the past 90-days. As you can see the S&P has pretty much went nowhere, yet two different sectors have been hit hard!
CLICK ON CHART TO ENLARGE
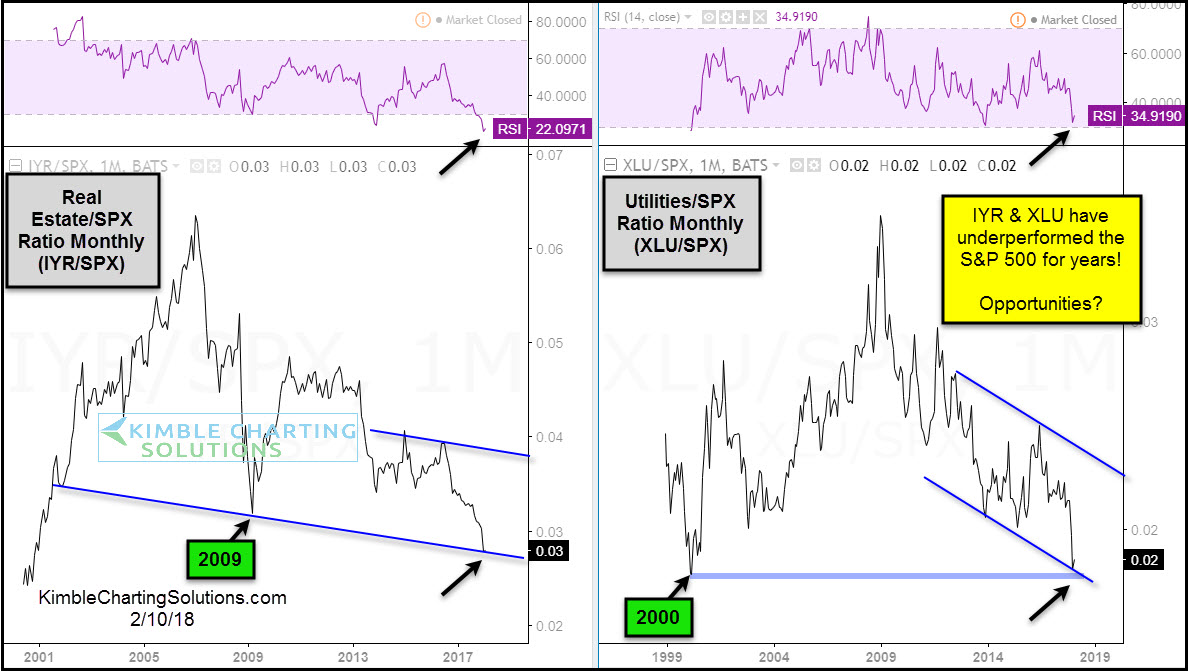
Not only has Real Estate and Utilities done poorly the past 90-days, they have under performed the S&P 500 for years!!! Below looks at relative performance of each compared to the S&P 500 since 2000.
CLICK ON CHART TO ENLARGE
The above charts reflect that it has “paid to avoid” these sectors on a relative performance basis. The question to ask yourself is this…Could the years of relative under performance turn into opportunities? These assets are testing potential support and momentum is deeply oversold.
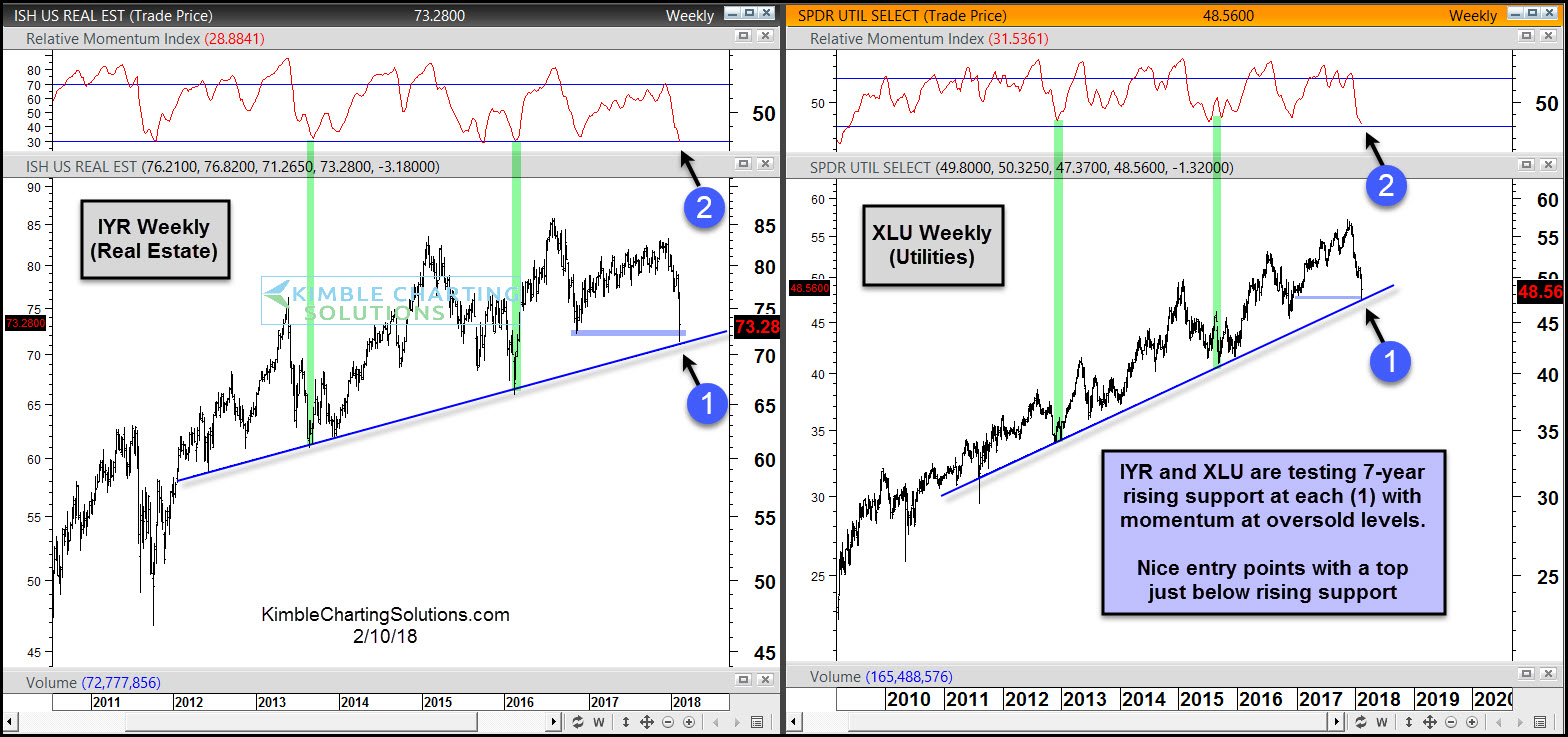
Below takes a look at the chart patters of Real Estate (IYR) and Utilities (XLU) over the past decade-
CLICK ON CHART TO ENLARGE
XLU & IYR are each testing 7-year rising support with momentum at oversold levels. When momentum was this oversold in the past 5-year, each was closer to a low than a high.
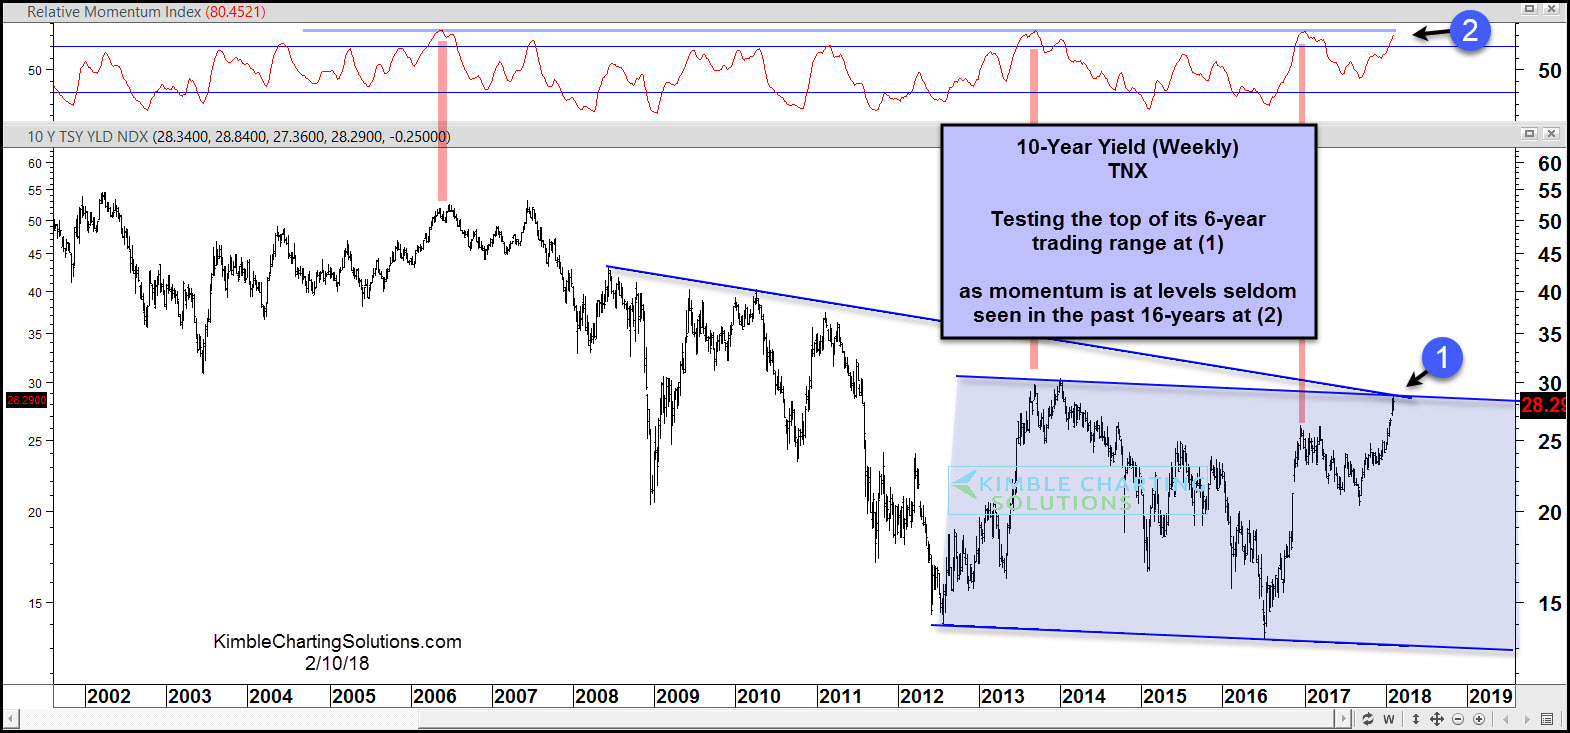
Are you thinking that XLU and IYR will continue to do poorly because interest rates are going to rise? Below looks at the yield on the 10-year note since 1999, reflecting that yields have increased by 88% over the past 80-weeks. This sharp of rally has only taken place one other time in the past 20-years!
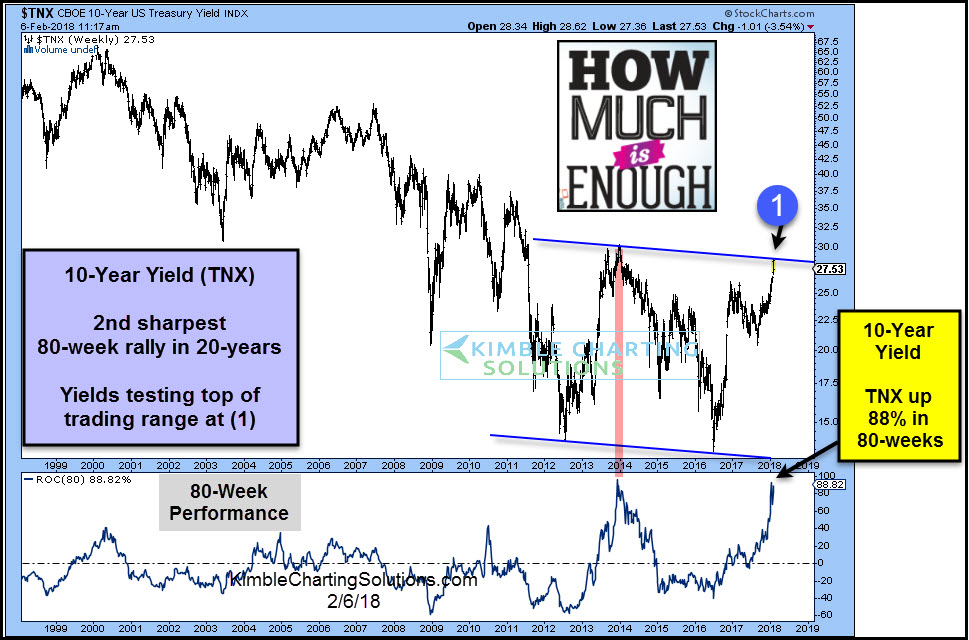
The sharp rally in yields now them testing the top of its 6-year rising channel at (1),as momentum in the 10-year yield is the highest in years highlighted in the chart below.
CLICK ON CHART TO ENLARGE
Bottom line– We believe that XLU and IYR are presenting buying opportunities with nice risk/reward potential, as stops can be placed just below 7-year rising support lines.
