

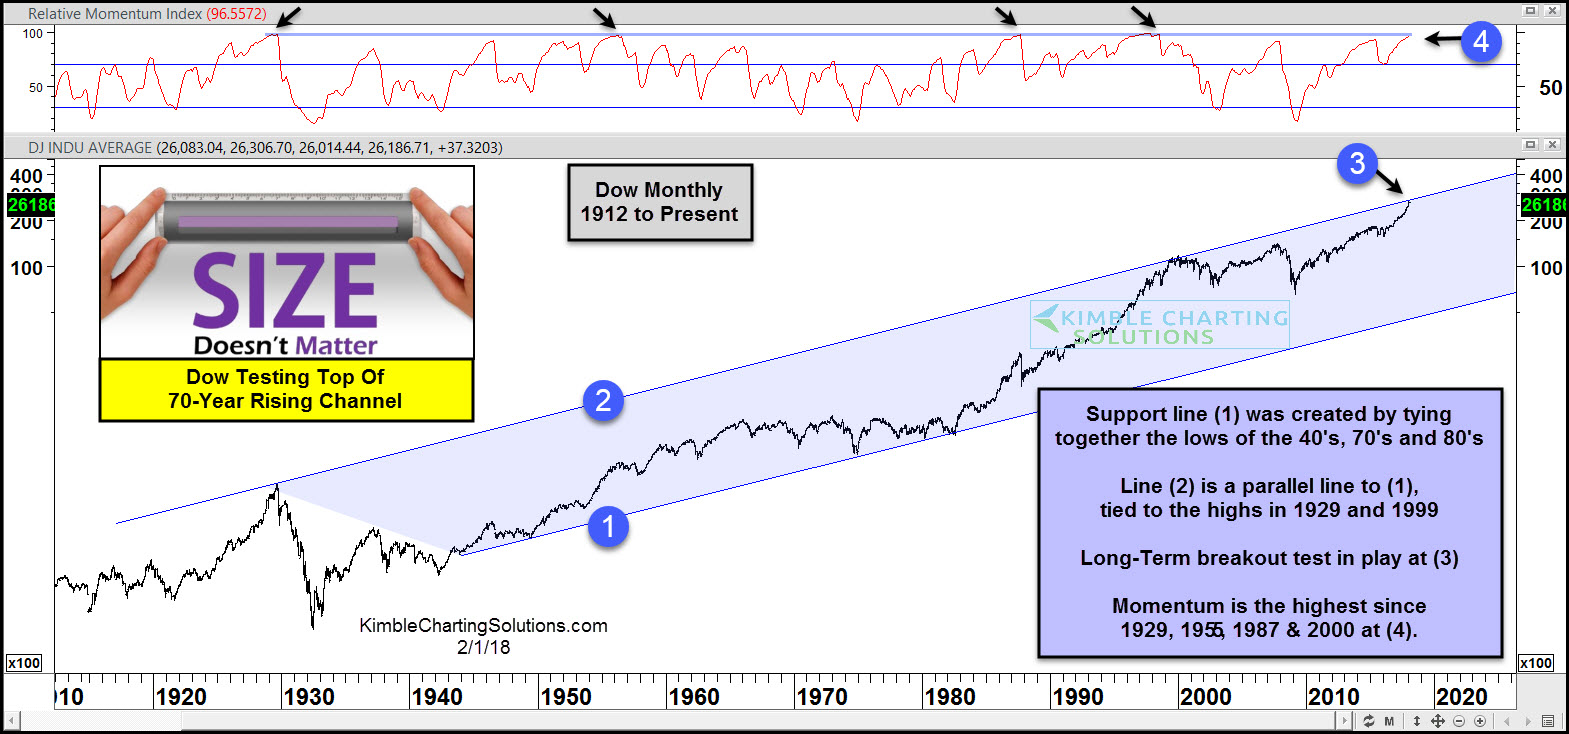
Last Friday Joe Friday shared this “Just The Facts Ma’am”- The Dow was hitting “momentum last seen in 1929, 1987 & 2000” in the chart below. (See Post Here)
 CLICK ON CHART TO ENLARGE
While momentum was reaching momentum levels seldom seen in 100-years, the Dow was testing the top of 70-year rising channel at (2). See update to last weeks chart below. 
CLICK ON CHART TO ENLARGE
The Dow at the end of January hit the top of its 70-year rising channel at (2), where selling pressure started taking place. The decline the past few days now has the Dow testing short-term rising support at (3). If this support gives way, don’t be surprised to see more selling pressure get started.
Does a 1-day decline of 1,000 points work off momentum that is at levels only seen in 1929, 1987 and 2000? No!
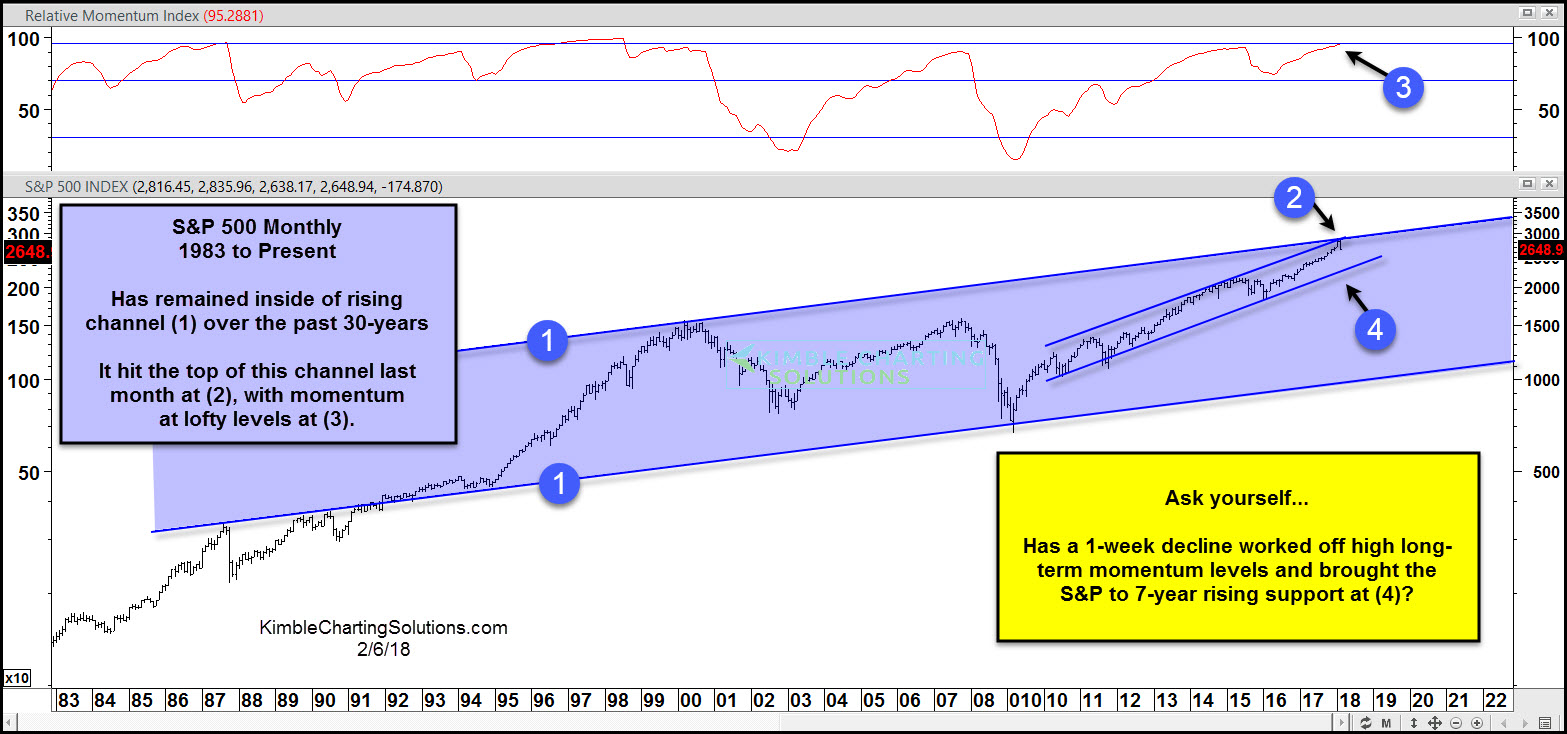
Below looks at the S&P 500 over the past 30-years-
CLICK ON CHART TO ENLARGE
Similar to the Dow, the S&P 500 finds itself at the top of a long-term rising channel with momentum hitting levels seldom seen in decades.
The media most likely will get caught up on some very short-term price action this morning and the next couple of days. We wanted to share these long-term charts on the Dow and S&P to keep this perspective in mind; that the long-term trends remains up and long-term momentum still remains high as both index’s remain just below the tops of very long-term rising channels.
