

Below looks at the Dow Jones Industrial average over the past 100-years. The long-term of the Dow remains up. The action of the past couple of weeks has NOT changed that fact.
We do find this interesting-The Dow Industrials finally moved into correction territory after one of its longest-ever stretches without one. Even more interesting, this ranks as the 4th-fastest correction ever from an all-time high
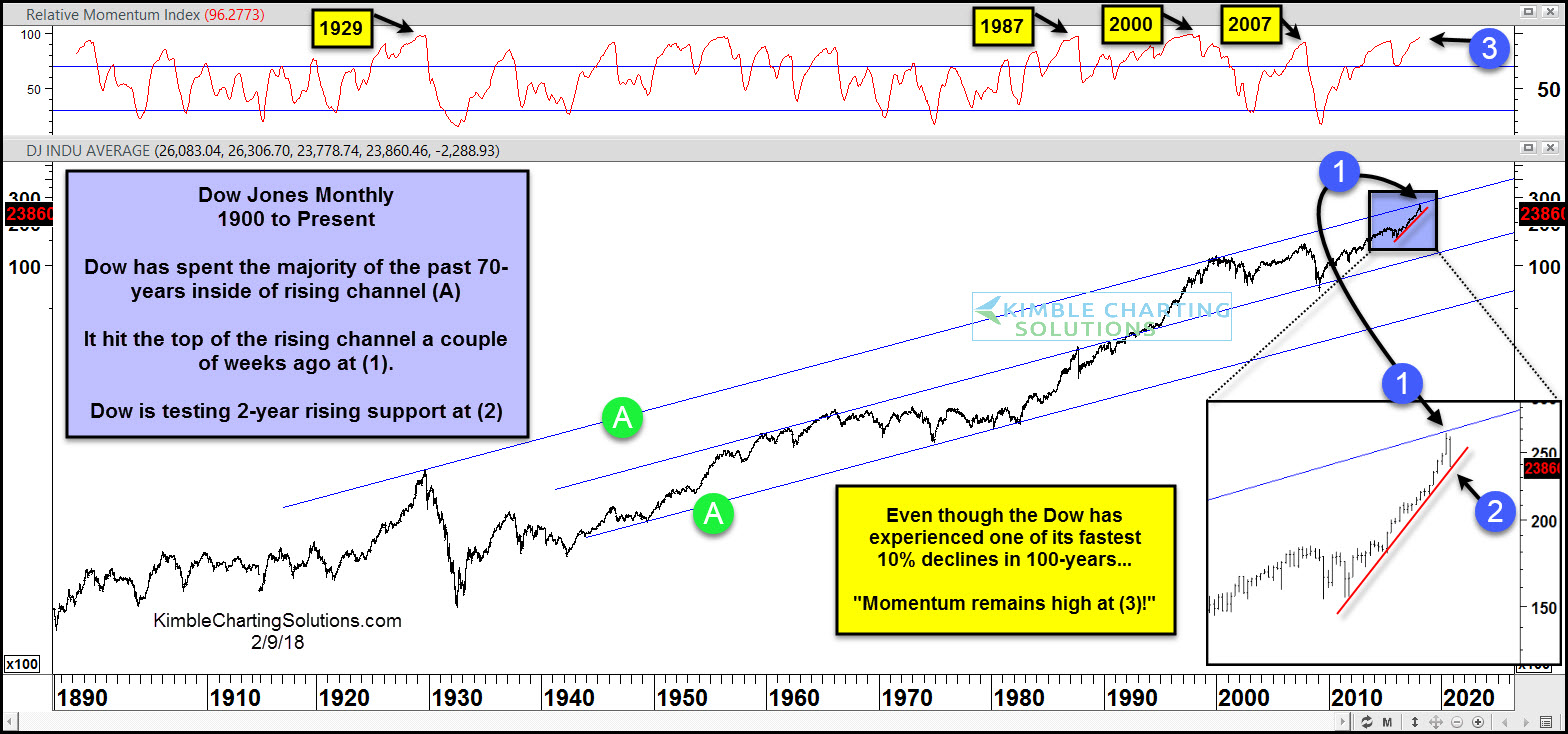
Has this decline and loss of Trillions of dollars caused the Dow’s momentum to become oversold? Below looks at the Dow over the past 100-years on a monthly basis with momentum applied.
CLICK ON CHART TO ENLARGE ABOVE
The Dow has spent the majority of the past 70-years inside of rising channel (A). Long-term buy & holders/passive investors most often do best when buying near long-term support when momentum is oversold. Combinations like this in the the past 40-years took place in the early 1980’s, 2003 and 2009.
Historically buy & hold/passive investing has seen sub-par returns going forward when the Dow was near the top of the rising channel as momentum was hitting lofty levels.
Joe Friday Just The Facts Ma’am– Momentum remains near 1929, 1987, 2000 & 2007 levels at this time. From a long-term perspective it would appear that it is important that short-term support holds at (2) as the top of the 70-year channel remains just overhead.
If you would like to stay informed weekly about patterns that can help with your buy & hold/passive investments, we would be honored if you were a Global Trends Report or Premium Member.
