

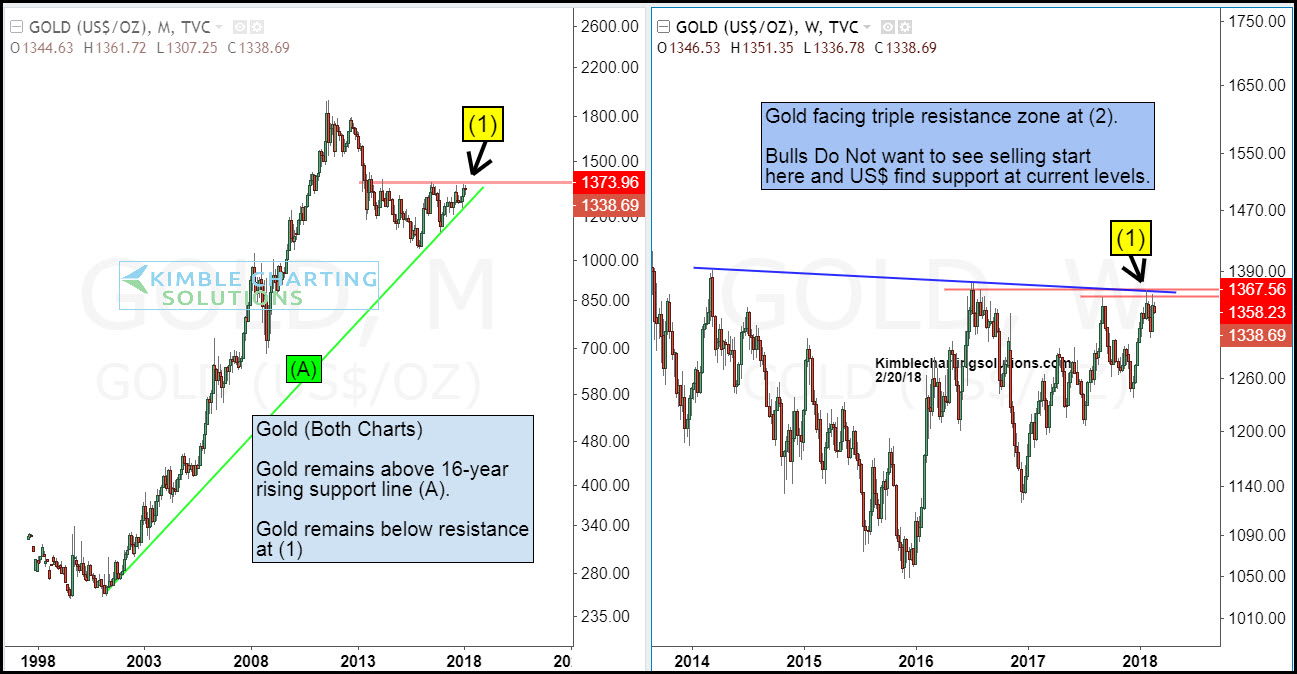
Certain price zones for all assets come into play where bulls would not want to see selling get started. Below highlights one of those points for Gold Bulls.
The left chart looks at Gold over the past 20-years and the right chart zooms in to look at just the past 4-years.
CLICK ON CHART TO ENLARGE
For nearly 20-years, Gold has created a series of higher lows above the line (A) in the left chart. The lows in 2016 and 2017 did NOT break this rising support line, which is a positive/bullish for the bulls.
The right chart highlights that Gold continues to find three different resistance lines to be heavy resistance at (1), with higher lows taking place over the past 2-years.
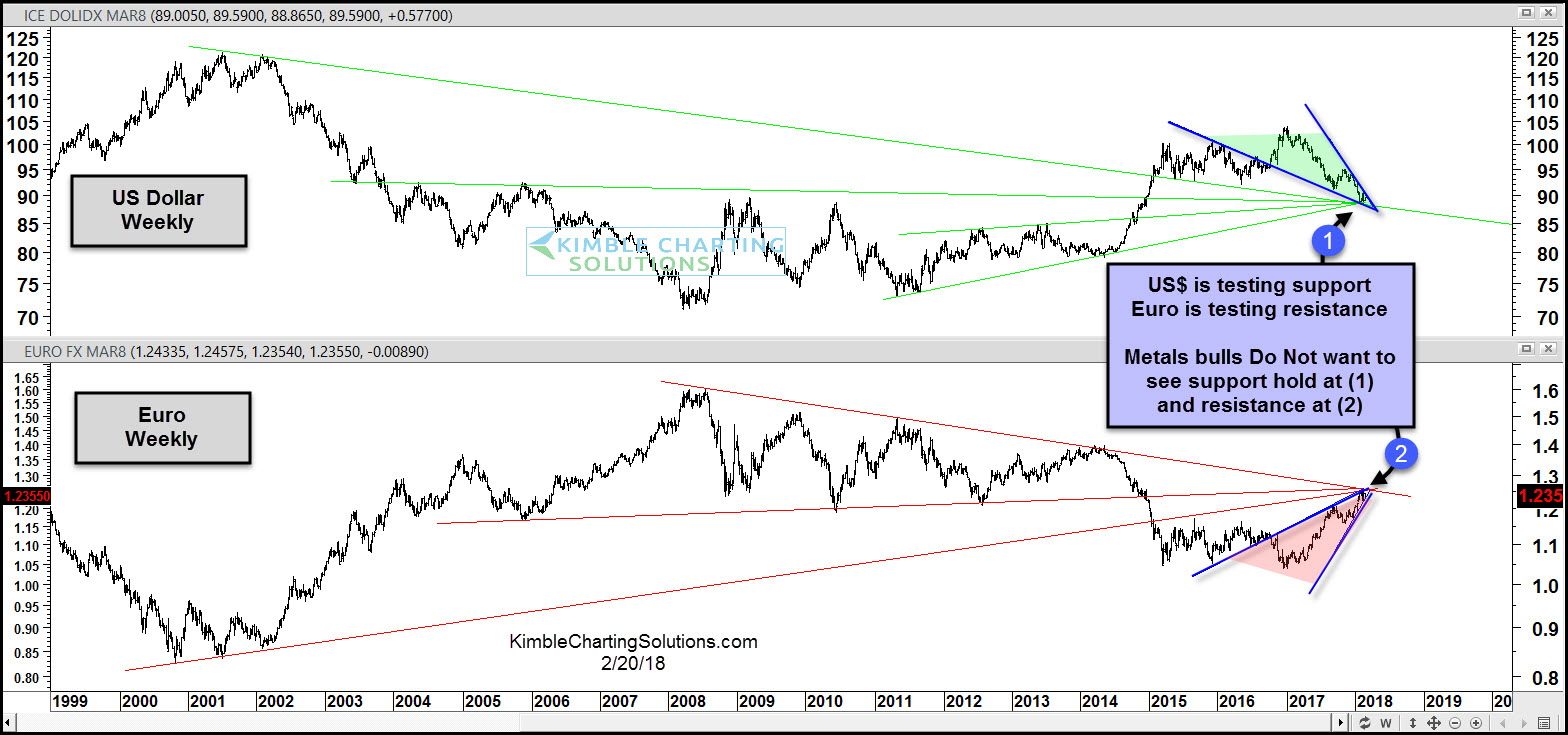
Below looks at 20-year charts on the US$ and the Euro-
CLICK ON CHART TO ENLARGE
The 10-year trend in the US$ is up (higher lows) and the 10-year trend in the Euro is down (lower highs).
The 1-year trend in the US$ is down (highs lower) and the 1-year trend in the Euro is up (high lows).
The decline over the past year in the US$ and the rally in the Euro has the US$ testing a cluster of support and the Euro testing a cluster of resistance.
Metals bulls in the top chart Do Not want to see selling pressure start at (1) and they do not want to see selling pressure start at (2) in the Euro. At the same time metals bulls do not want to see buyers come forward a (1) and breakout above falling resistance.
Tomorrow we will be conducting a private briefing for our blog viewers and these charts will be two of many that we will discuss. We will discuss how to play breakouts/breakdowns in Gold, US$ and the Euro. If you would like to attend our FREE webinar….CLICK HERE TO REGISTER

