
CLICK ON CHART TO ENLARGE
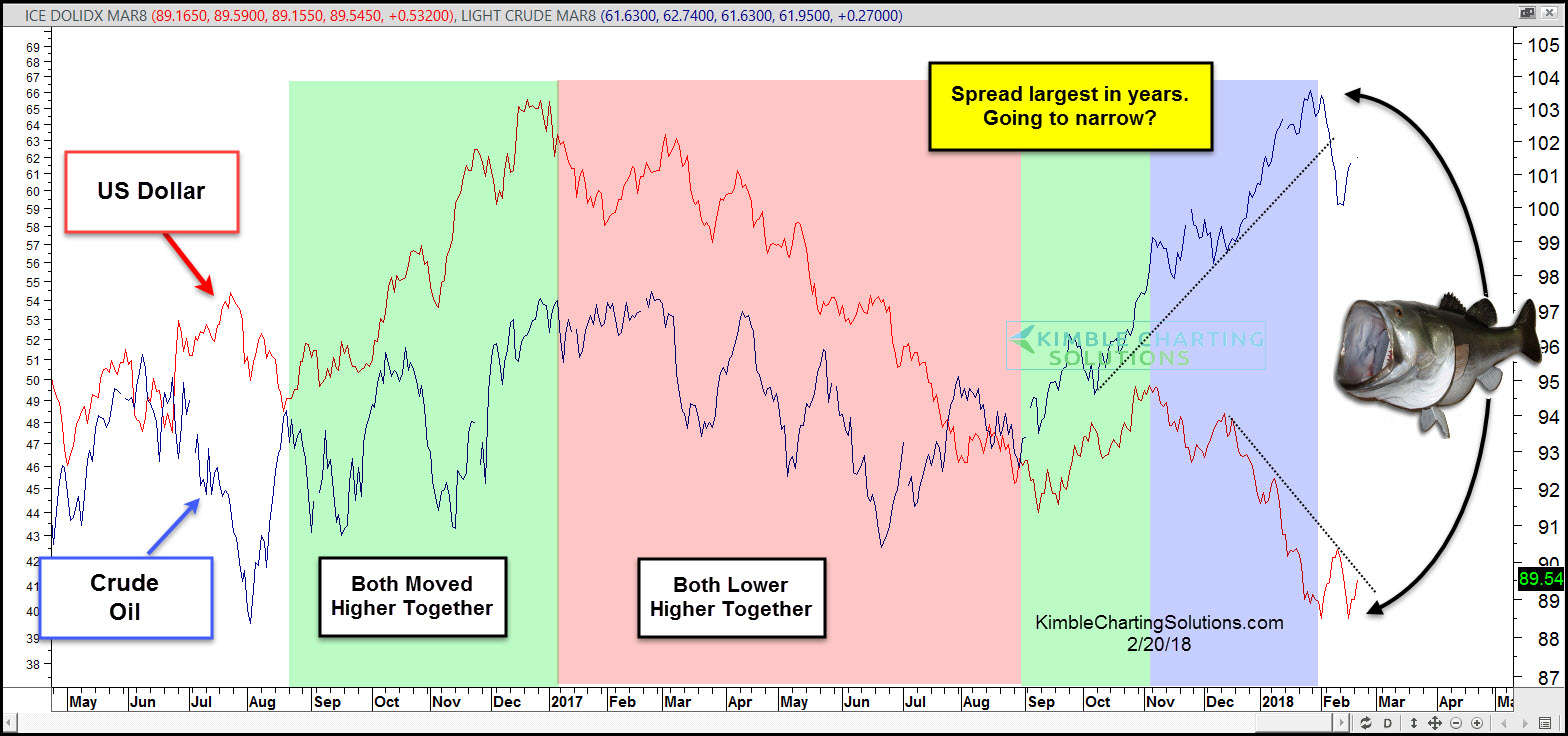
King Dollar & Crude Oil sometimes dance to the same tune (correlate) and sometimes they head in opposite directions (non-correlate).
Above looks at the correlation between the two over the past couple of years. From September of 2016 until November of 2017, the tended to move in unison. Since November of 2017, they have been pretty much moving in opposite directions, creating one of the larger “Fish Mouth” spreads between the two in a couple of years.
If Crude Oil breaks support and the US$ happens to break overhead resistance, these two could continue to non-correlate and the spread could narrow. If they would narrow, could have an important impact on numerous assets!
Tomorrow we will be conducting a private briefing for our blog viewers and these charts will be two of many that we will discuss. We will discuss how to play breakout/breakdowns in Gold, US$ and the Euro. If you would like to attend our FREE webinar….CLICK HERE TO REGISTER

