
Moving average and momentum models work, no doubt about it!!!
Every good strategy has its weak points though. Could these quality strategies be entering into a time frame where they will struggle again? Possible!
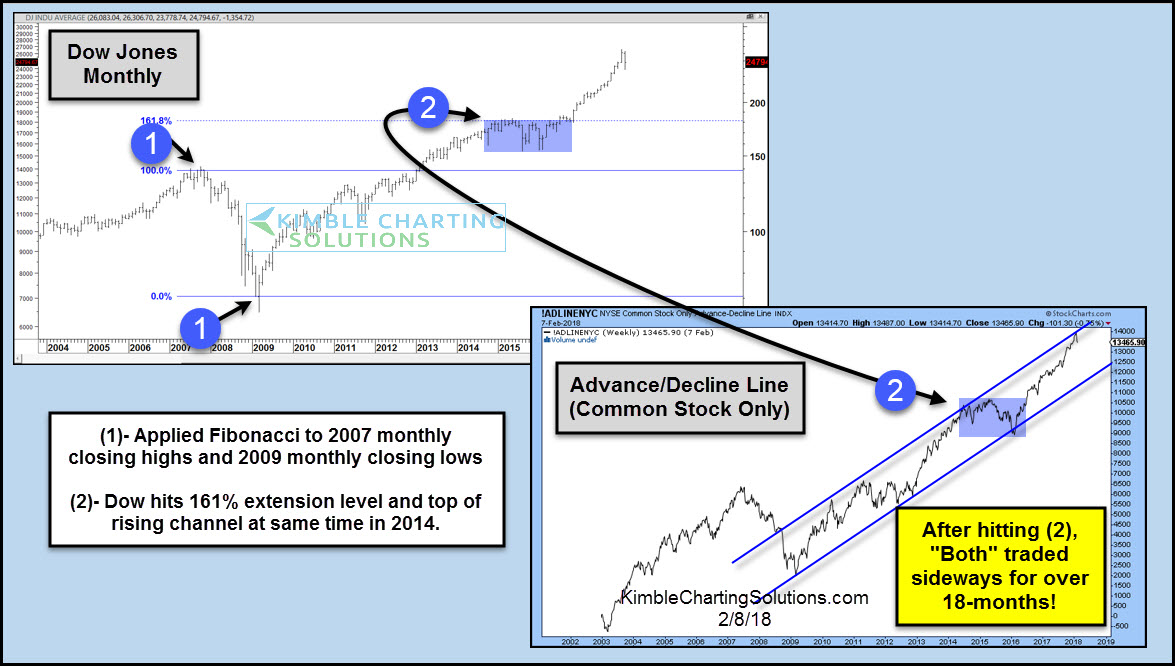
Below looks at chart we shared with members last week. The upper left chart highlights that the Dow hit its 161% extension level in 2014 and the advance decline line hit the top of its multi-year rising channel at each (2) at the same time. Results- both traded sideways for the next 18-months.
What type of markets challenge moving average/momentum models the most? A sideways/narrow markets!
CLICK ON CHART TO ENLARGE
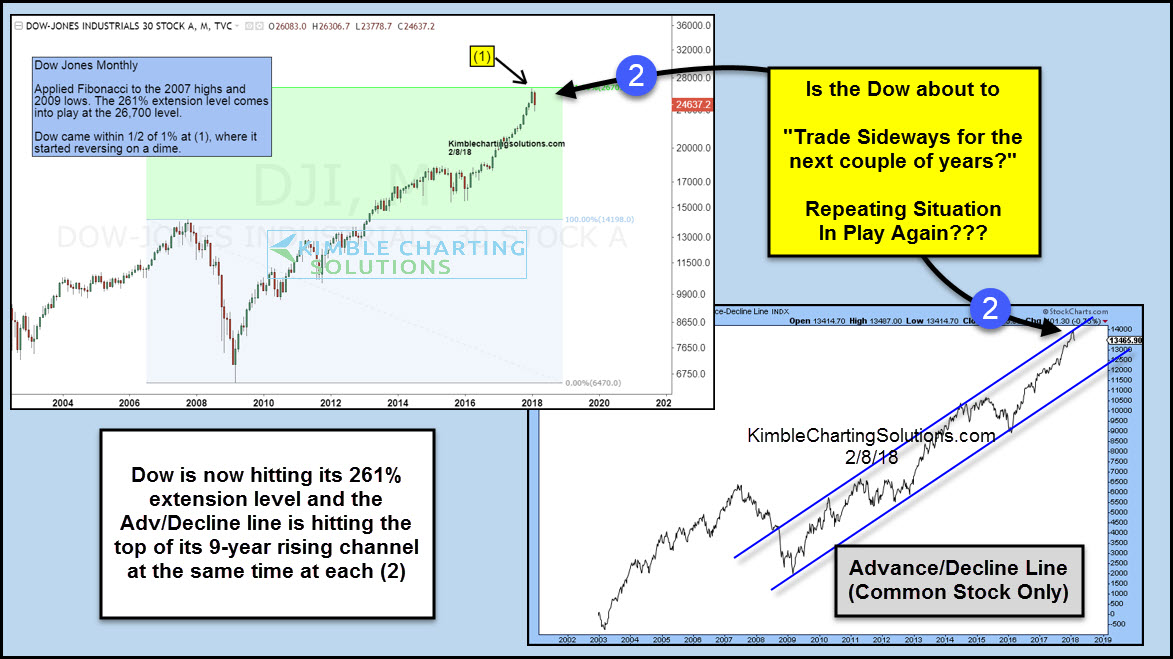
The two pack below highlights that the Dow and Advance/Decline line could be repeating what they did back in 2014.
CLICK ON CHART TO ENLARGE
The Power of the Pattern has been sharing for 15-months that the Dow 261% level at 26,700 was probable to be reached and that this level could be a heavy resistance zone. While the Dow was nearing the key extension level the Advance/Decline ratio was hitting the top of its 9-year rising channel. Both are hitting these potential key levels at the same time at each (2).
Should it be a total surprise that we just experienced one of the quickest 10% decline in history? Not so much
The last time the Dow hit a extension level based up the 2007 highs/2009 lows was in 2014 and it traded sideways for just short of 2-years. Now the Dow is testing another extension level based up the 2007 highs/2009 lows while the Adv/Dec line is testing the top of its rising channel. The last time this took place moving average/momentum models struggled. These models hope it will be different this time.
Next Wednesday we are conducting a a private briefing exclusively for our blog subscribers. We will discuss numerous opportunities in stocks, Metals and Crude Oil Markets. Click HERE to register for the webinar.

