
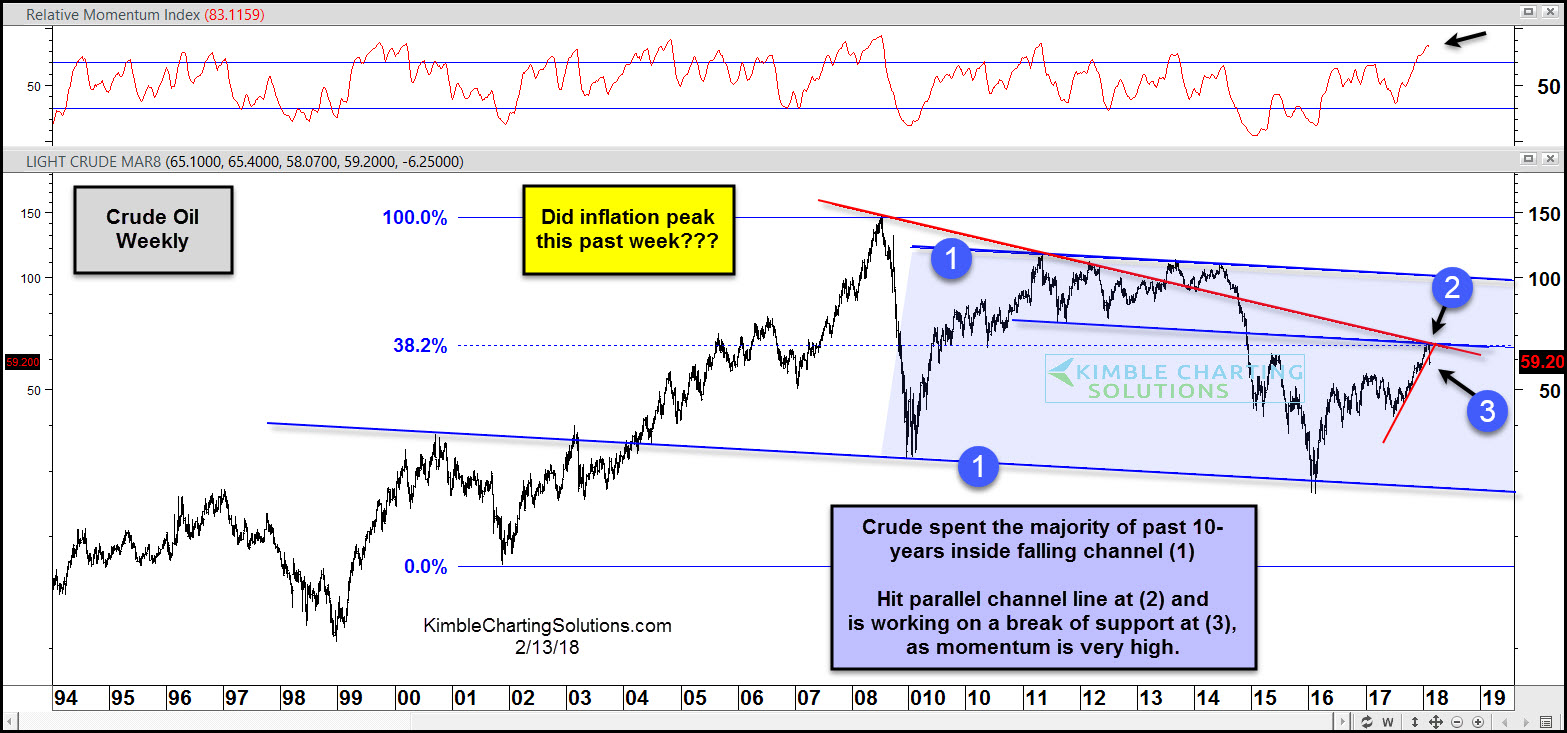
I shared the chart below on Crude Oil in my Coffee with Chris email to members Saturday morning. This chart looks at Crude Oil over the past 20-years and highlights a triple test of resistance is in play along with a crowded trade.
CLICK ON CHART TO ENLARGE
Crude hit long-term support line (1) back in 2016 and a very strong rally followed. This rally took Crude of late up to its 38% retracement level of its 2002 lows/2009 highs at (2). While it was testing the 38% level it was also testing two falling resistance lines at (2), with momentum at its highest level in the past 7-years.
Crude is testing steep rising support at (3). This is a price point that Crude bulls would not want to see selling pressure get started.
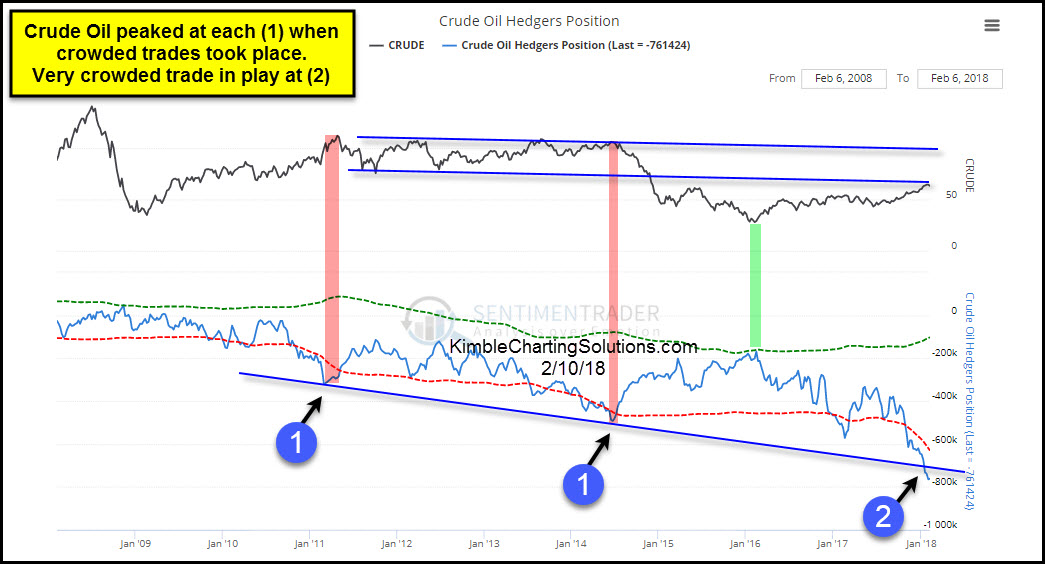
Speaking of Crude bulls, a very crowded trade is in play below. Sentimentrader.com chart highlights positions by traders is at an extreme-
CLICK ON CHART TO ENLARGE
When traders have established a crowded trade in Crude at each (1) above, Crude was closer to a high than a low. They have established another crowded trade of late at (2) it appears.
In time it will be interesting what Crude does with the potential resistance test at (2) in the top chart as traders might have a crowded trade in play at (2) above.
