CLICK ON CHART TO ENLARGE
The above chart takes a look at the S&P 500/10-year Yield (TNX) ratio over the past 10-years. At the time of the financial crisis lows, the ratio itself was very low and created a series of higher lows in 2009, before embarking on a quality rally for years.
Over the past few years, the ratio has, for the most part, traded sideways. While trading sideways it could be forming a multi-year “head & shoulders” topping pattern.
Even if the head & shoulders pattern is NOT a correct read, the key to this pattern in my humble opinion is that a 3-year test of support is in play at (1). At this time let’s be clear about this…Support is Support until broken.
If 3-year support would give way, it would send caution message to stocks.
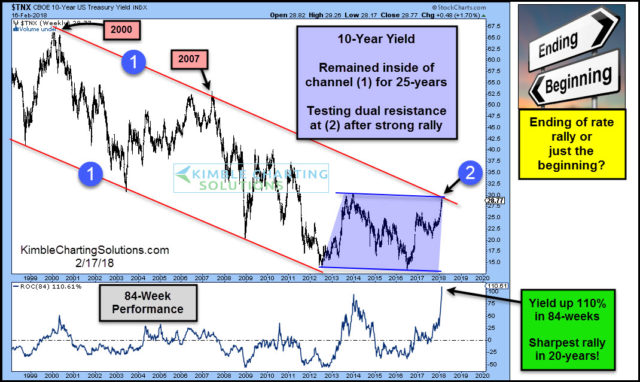
Below looks at yields are testing 25-year falling resistance after being up 110% in the past 84-weeks, which was the sharpest rally in 20-years! What yields do at the top of the 25-year falling channel will have an impact on the stock/bond yield ratio!
CLICK ON CHART TO ENLARGE
I am of the opinion that several “Multi-Decade Opportunities” are facing each of us at this point in time.
In honor of my 38th anniversary in the financial services industry, rare pattern opportunities in play and how important they could be to both bulls and bears, we produced a FREE WEBINAR yesterday. We were honored by the overwhelming response to the webinar. We did have one problem, we had an overflow of people wanting to attend the webinar and many were unable to attend, as the meeting exceeded its maximum of 1,000 registrants.
For those of you that were not able to view the webinar or would still like to see these opportunities, you still can! We offered $45,000 in free bonus research yesterday, check out the video per how you could get part of this bonus program.
Click here to view “Multi-Decade Opportunity” Webinar.


