CLICK ON CHART TO ENLARGE
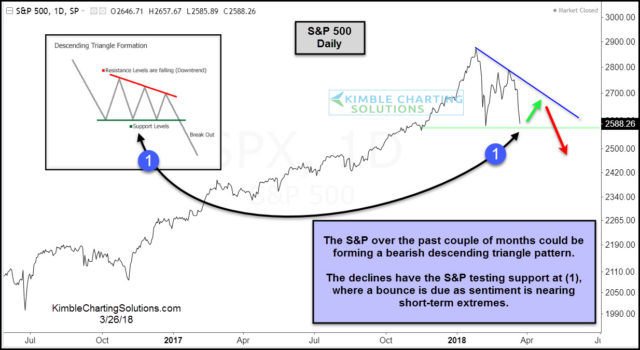
This year the S&P 500 could be forming a bearish descending triangle. The declines over the past couple of weeks now have the broad market testing key support levels at (1) above. The Dow looks to be forming a similar descending triangle pattern, where a bounce is due as well says Joe Friday.
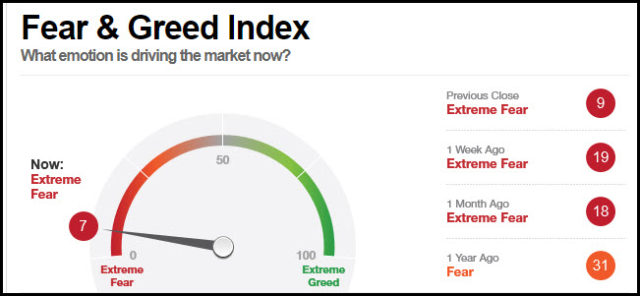
While the Dow and S&P are both testing support at the same time, the CNN Fear/Greed indicator is now at short-term extremes (excess fear).
CLICK ON CHART TO ENLARGE
The combo of the Dow and S&P testing support and sentiment at extremes suggests that a bounce is due!
Falling resistance for the S&P comes into play around the 2,700 level (around 4-5% above current prices). Bulls want to see a bounce take place and this resistance line broken to the upside, so it can negate the bearish pattern.
Bulls do not want to see the support line in the Dow and S&P taken out after short-term bounces, as that would suggest the short-term downtrend will continue. If support would happen to not hold, measured moves would suggest the Dow and S&P could fall at least another 5%.
–


