CLICK ON CHART TO ENLARGE
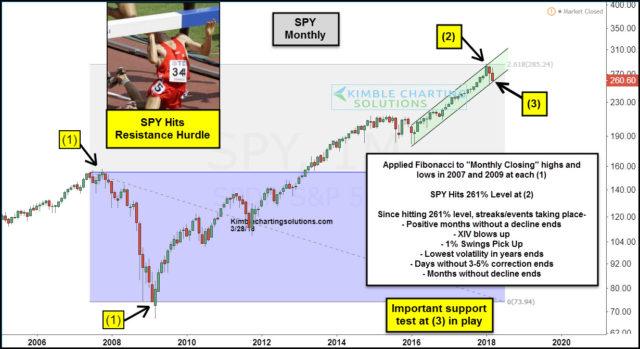
The Power of the Pattern believes that two of the most important emotional highs and lows over the past 11-years are the highs in 2007 and the lows in 2009.
We applied Fibonacci to the 2007 highs/2009 lows at each (1). The 261% Fibonacci extension level came into play at (2) at the 285 level. Numerous streaks and the overall character seemed to change once the S&P hit the 261% level at (2).
Even though many streaks have ended and the overall character of the SPY has changed since hitting the 261% level, it still remains inside of a 2-year rising channel. SPY bulls would get a very concerning message if support would break at (3)!
–


