
CLICK ON CHART TO ENLARGE
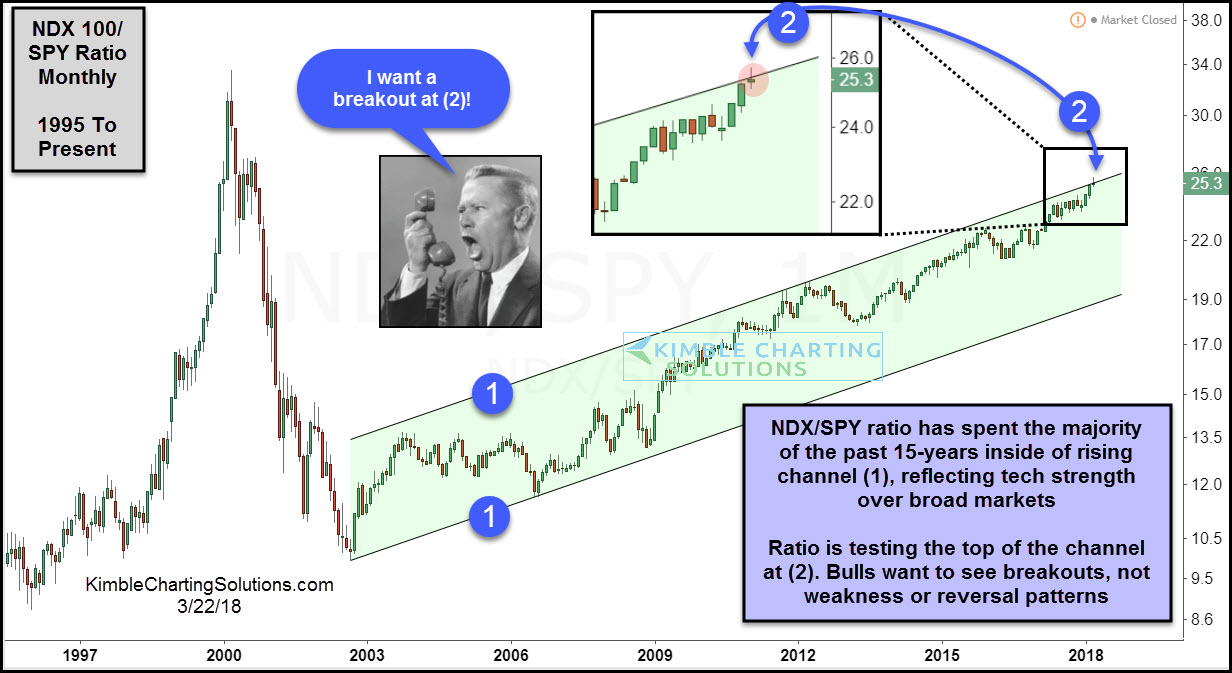
Tech stocks have been on a roll for the past 15-years (long-term bull trend) and nothing of late has changed that! Above looks at the Nasdaq 100/SPY ratio on a monthly basis over the past couple of decades.
Over the past 15-years, the ratio has spent the majority of the time inside of rising channel (1), highlighting that tech has been in a leadership role for years and years. The ratio is now testing the top of this rising channel at (2) this month.
The ratio is now at a price point where it is important to see a breakout. Tech bulls would get a caution message if weakness or a reversal pattern takes place at (2).
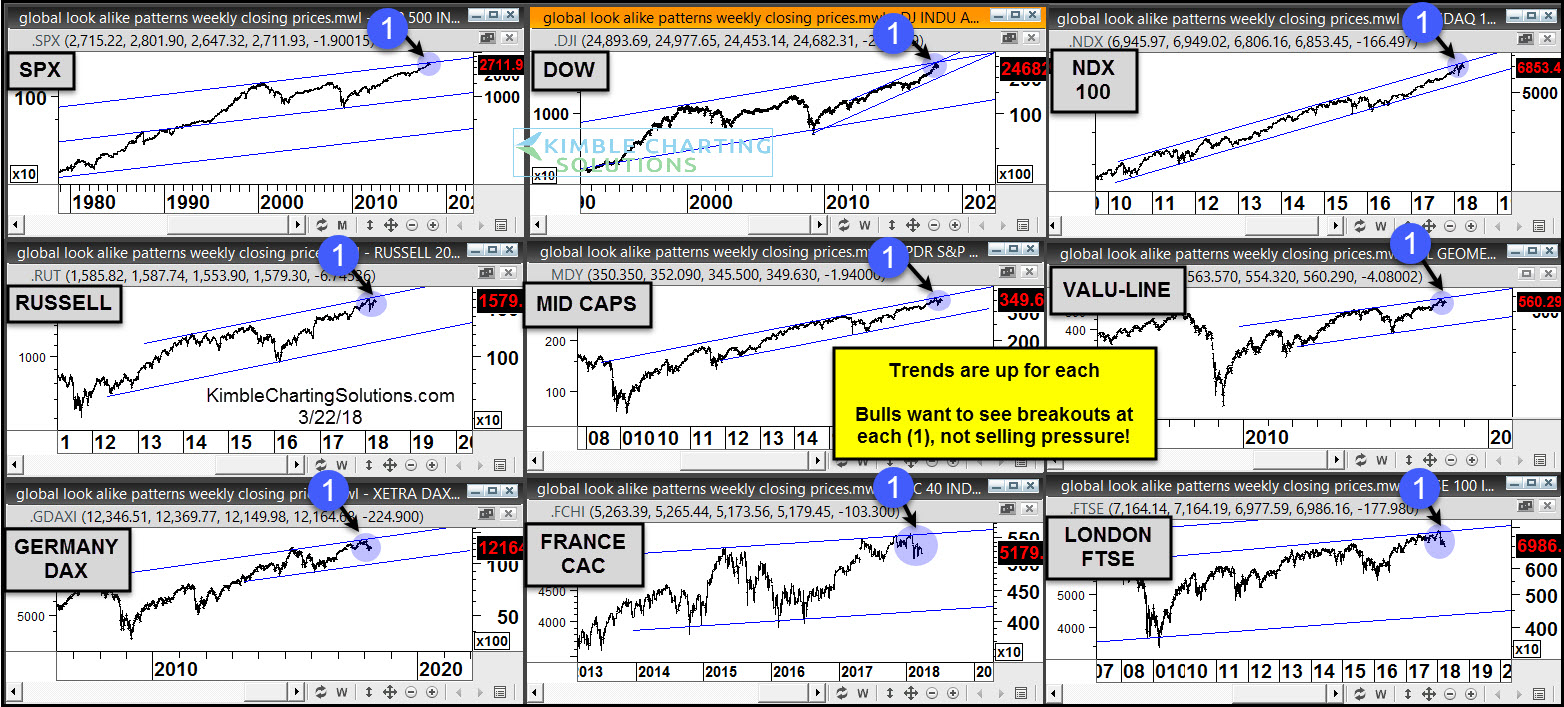
Below looks at key stock indices around the world-
CLICK ON CHART TO ENLARGE
Each of these indices is in solid long-term bull trends and nothing of late has changed that! Each is testing breakouts at each (1).
Similar to the NDX/SPY chart above, these indices want to see breakouts, not selling pressure getting started at each (1)!
–
View our most recent webinar multi-decade patterns in play and how to take advantage

