
CLICK ON CHART TO ENLARGE
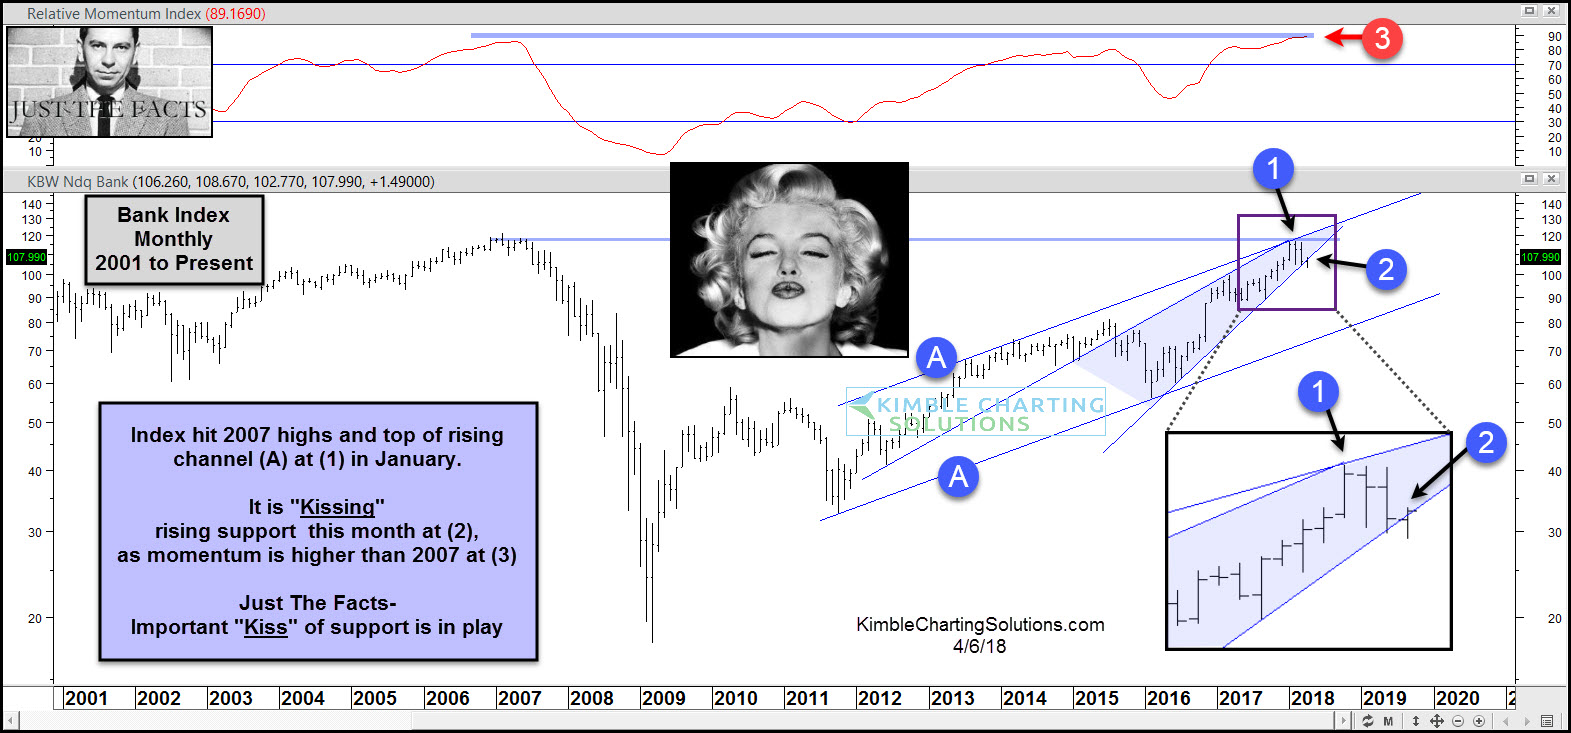
This chart looks at the Bank Index over the past 17-years on a monthly basis. The index has remained inside of a bullish rising channel (A) since the lows in 2011.
The rally over the past 7-years took it to the top of this channel and back to 2007 highs at (1) in January. Since hitting dual resistance at (1), banks have backed off right along with the broad market, declining a little over 7%.
Early in the month, Banks are “Kissing” rising support at (2), as momentum is currently higher than the peak levels in 2007.
Joe Friday Just The Facts- A key “Kiss” of support is taking place at (2). Important for the trend that this kiss holds and a rally in banks follow.
