
CLICK ON CHART TO ENLARGE
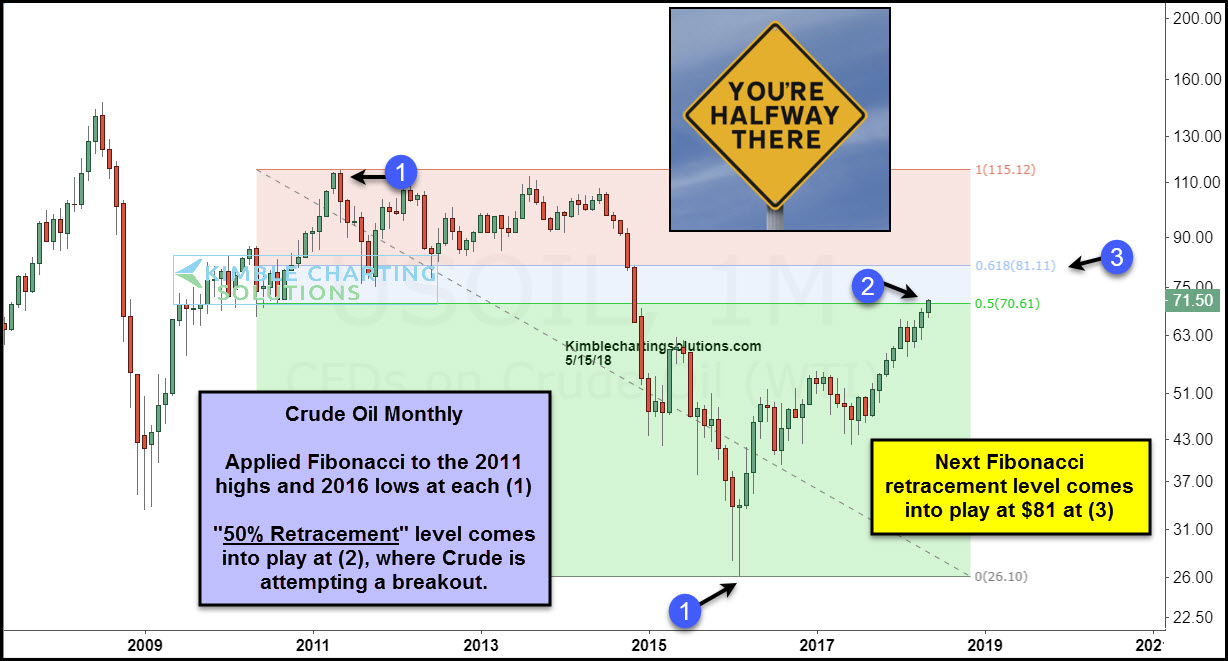
This chart looks at Crude Oil on a monthly basis over the past decade.
We applied Fibonacci retracement levels to the highs in 2011 and the lows in 2016 at each (1).
The rally of late has Crude attempting to break out above the 50% retracement level (which is the halfway point) of the 2011 highs and the 2016 lows at (2).
If Crude succeeds to break above the halfway point, the next Fibonacci retracement level comes into play at the $80 level at (3), which is over 10% above current prices.
–
