
CLICK ON CHART TO ENLARGE
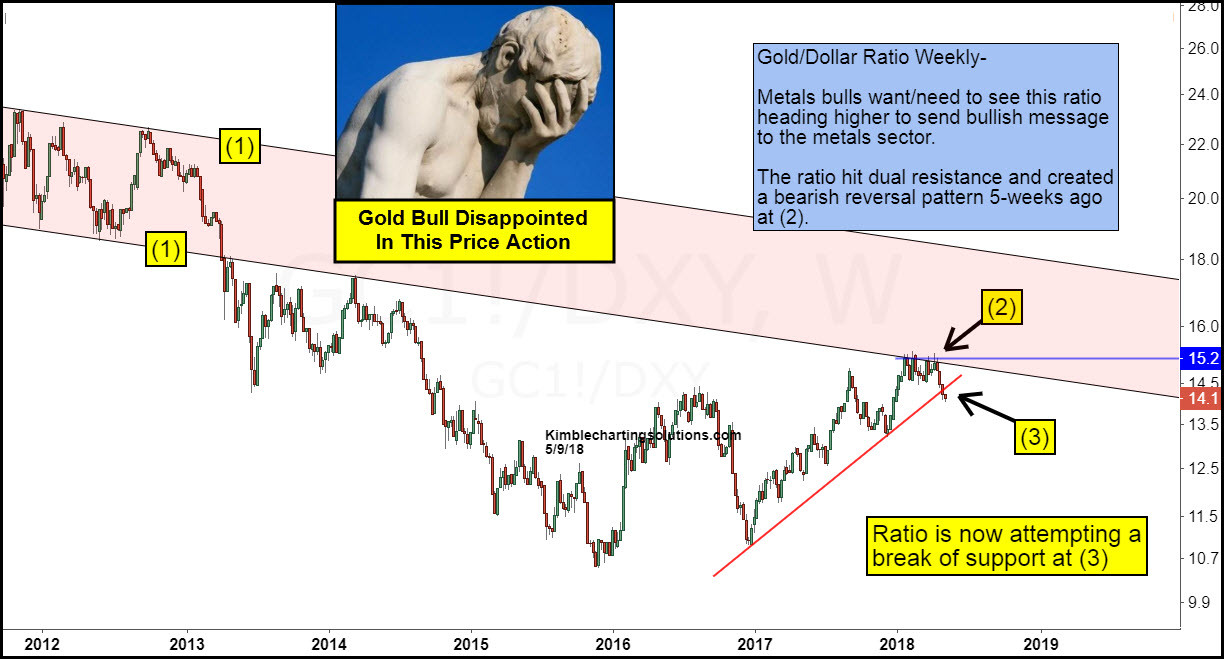
This chart looks at the Gold/US Dollar ratio over the past 7-years. Gold bulls want to see this ratio heading up and they get disappointing news when it falls in price.
Since 2011, the ratio started creating falling channel (1) and broke below it back in 2013. The rally that started back in 2016, saw the ratio make an attempt to climb back into falling channel (1) at (2). It tried to break back into this channel numerous times over a few months. After failing to break back into falling channel (1), it created a bearish reversal pattern 5-weeks ago and started heading lower.
The ratio is now attempting to break rising support of late at (3). If the ratio succeeds in breaking support at (3), it would send disappointing news to Gold bulls.
Gold bulls want to see strength in the ratio at (2), not continued weakness at (3).
–
