
CLICK ON CHART TO ENLARGE
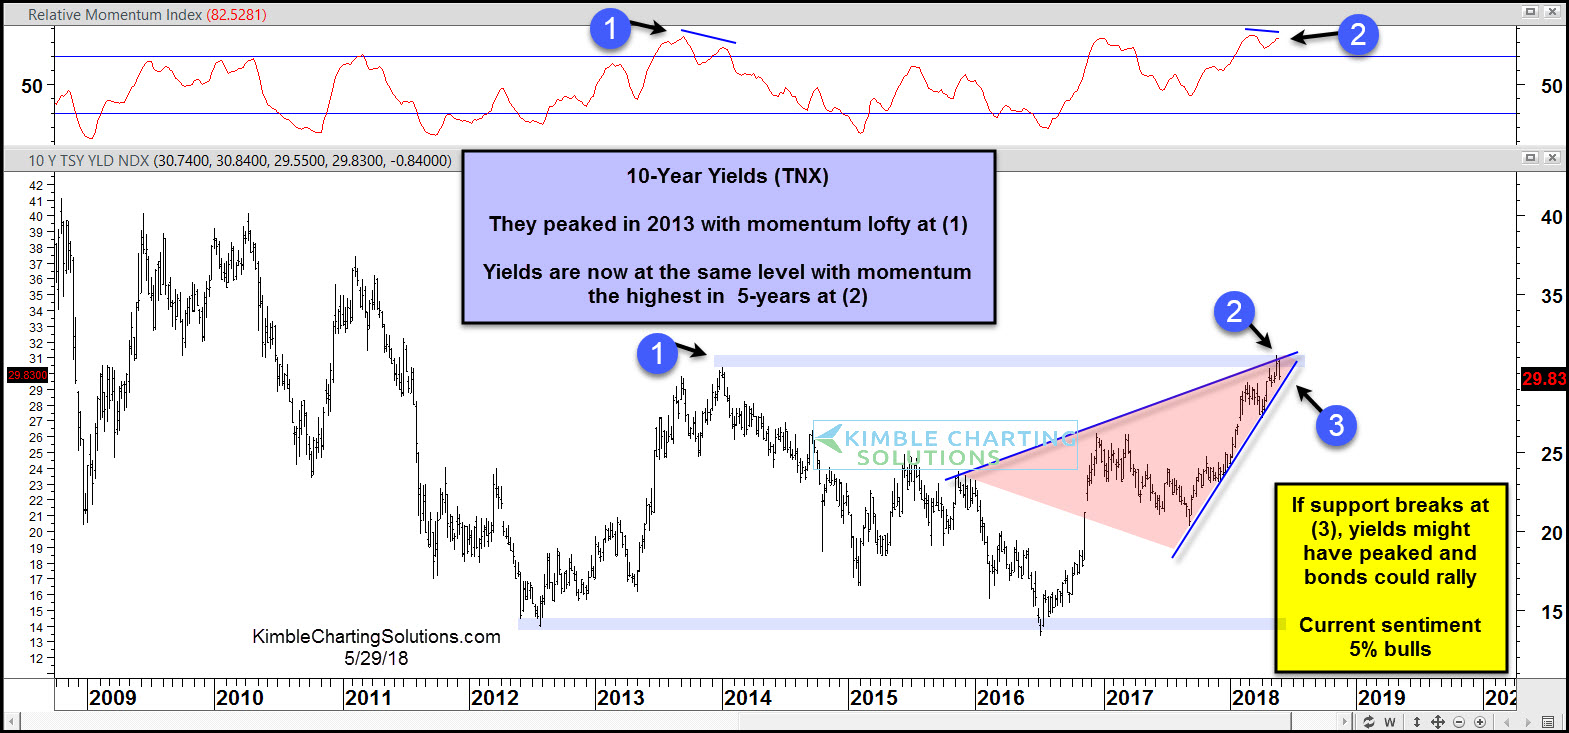
This chart looks at the Yield on the 10-year note over the past 9-years. A double bottom looks to have taken place as it hit identical lows in 2012 and 2016.
Yields have rallied since the lows in 2016 and are now testing the same level where they peak in 2013 at (1).
Is a double top taking place at (2), which is the same level as 2013 as momentum is also hitting lofty levels at (2). The rally in yields and the decline in bond prices has driven sentiment to levels rarely seen in the past decade (very few bulls).
Possible that a short-term peak in yields are taking place at (2), which is the same level where rates peaked in 2013.
