
CLICK ON CHART TO ENLARGE
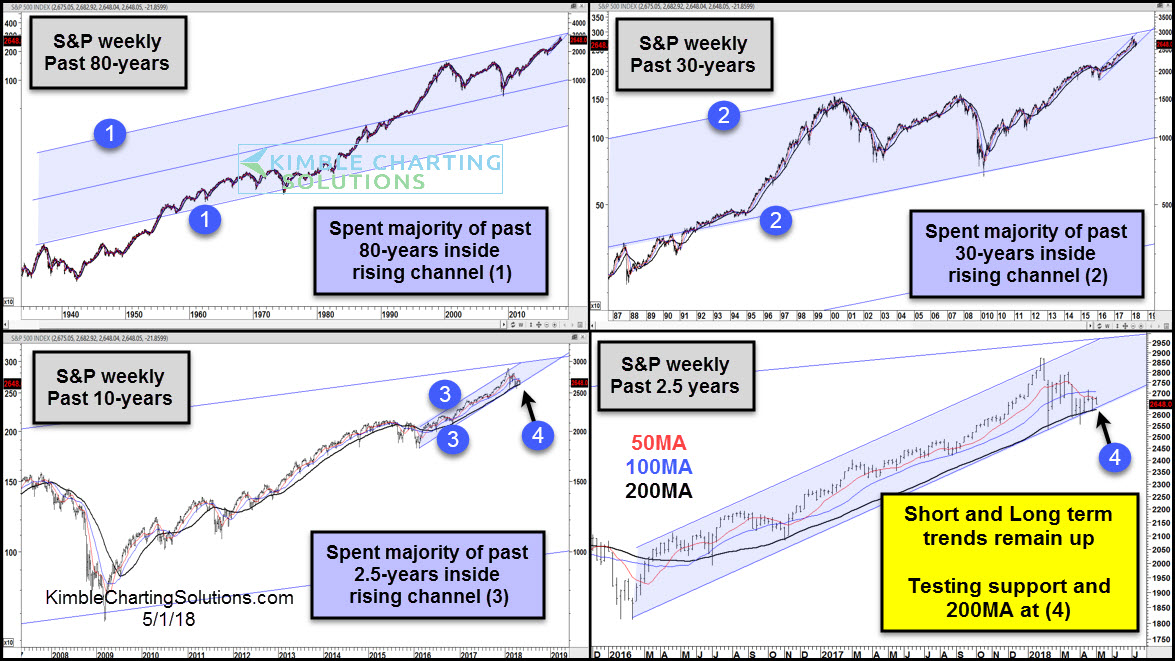
The above 4-pack looks at the S&P 500 on a weekly basis over four different time frames.
The S&P has spent the majority of the past 80-years (upper left chart) inside of rising channel (1) and the trend remains up.
The S&P has spent the majority of the past 30-years (upper right chart) inside of rising channel (2) and the trend remains up.
The S&P has spent the majority of the past 2.5-years (lower left chart) inside of rising channel (3) and the trend remains up.
The S&P is testing 2.5-year rising support and its 200MA line at (4) at this time. Long and Short-term trends remain up and support is support until broken.
This is an important test of support at (4) as the market enters the seasonal soft time of the year (sell in May and go away).
–
