
The U.S. Dollar Index has been mired in a correction for several months. During that time, stocks, gold, and oil exploded higher in 2017 and early 2018.
But the greenback has put together a multi-week rally. Is the correction nearing an end?
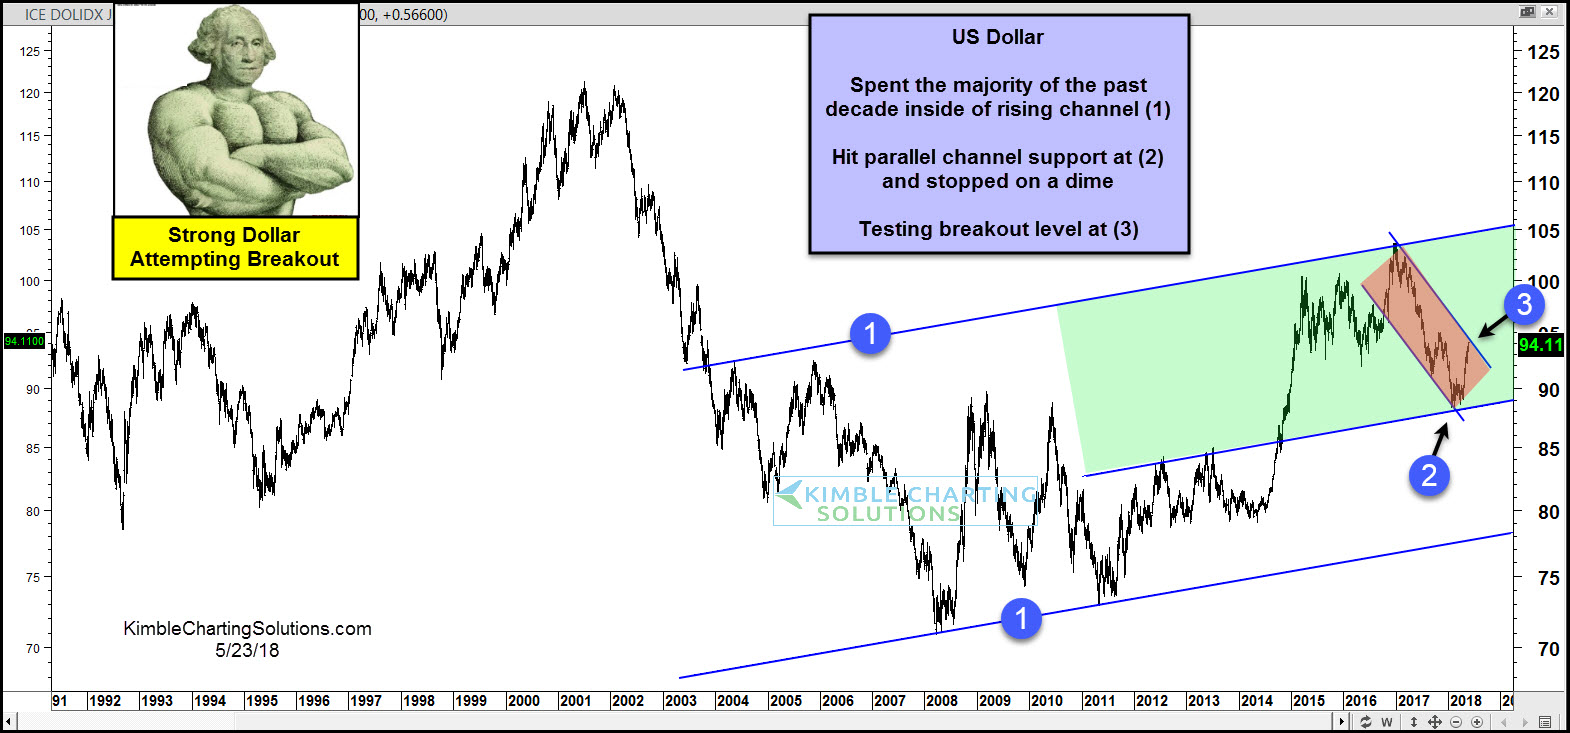
Looking at the chart below, you can see that the US Dollar Index has traded in a wide channel since bottoming in 2008 (1). It tested a mid-point trend line early in 2018 (2) and reversed back higher. It is now testing it’s downtrend resistance line (3).
U.S. Dollar Index Chart – Big Test!
CLICK ON CHART TO ENLARGE
A breakout here would be constructive for Dollar bulls. And it could set the stage for a test of the upper channel resistance (1). Some consolidation is possible here… bulls definitely would like to see a bull flag pattern develop (or an outright breakout).
However, should the Dollar reverse lower, it could set the stage for a retest of the 2018 lows.
In any event, commodity bulls/bears and asset managers should keep an eye on the Dollar in the weeks ahead!
This post was originally written for See It Markets.com. To see original post CLICK HERE
