
Gold has been weak for the past several weeks. So what gives?
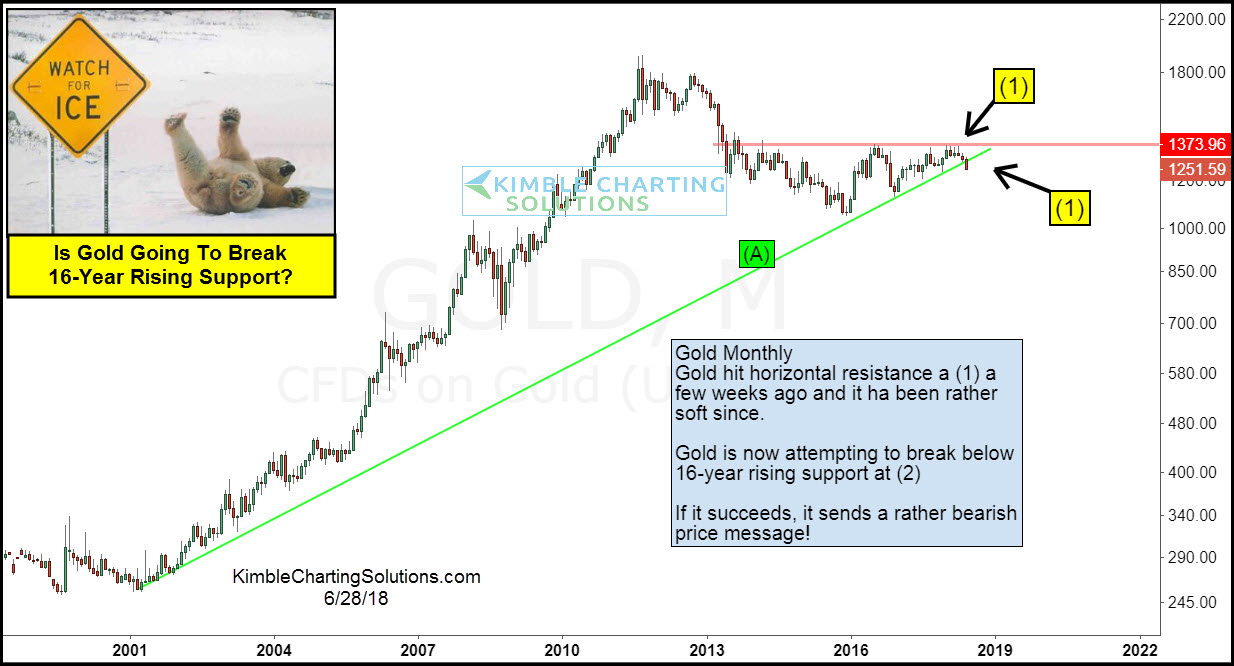
Gold prices have been trading in a tightening wedge pattern (between its rising trendline and horizontal resistance – see point 1) for several months. Bouncing back and forth in a narrowing range.
The latest test of horizontal resistance failed yet again, leading to a reversal that is trying to breakdown below the rising trend line (A).
This trend line represents a 16-year uptrend, so it has important implications for Gold.
If you are a gold bull, you are hoping for a strong recovery… and soon. The more time price spends below this trend line, the more concerning it is.
A breakdown here would send a rather bearish message to metals investors, so stay tuned!
Gold “monthly” Chart – Uptrend Line Breaking?
CLICK ON CHART TO ENLARGE
This article was originally written for See It Market.com. To see original post CLICK HERE
–
