
CLICK ON CHART TO ENLARGE
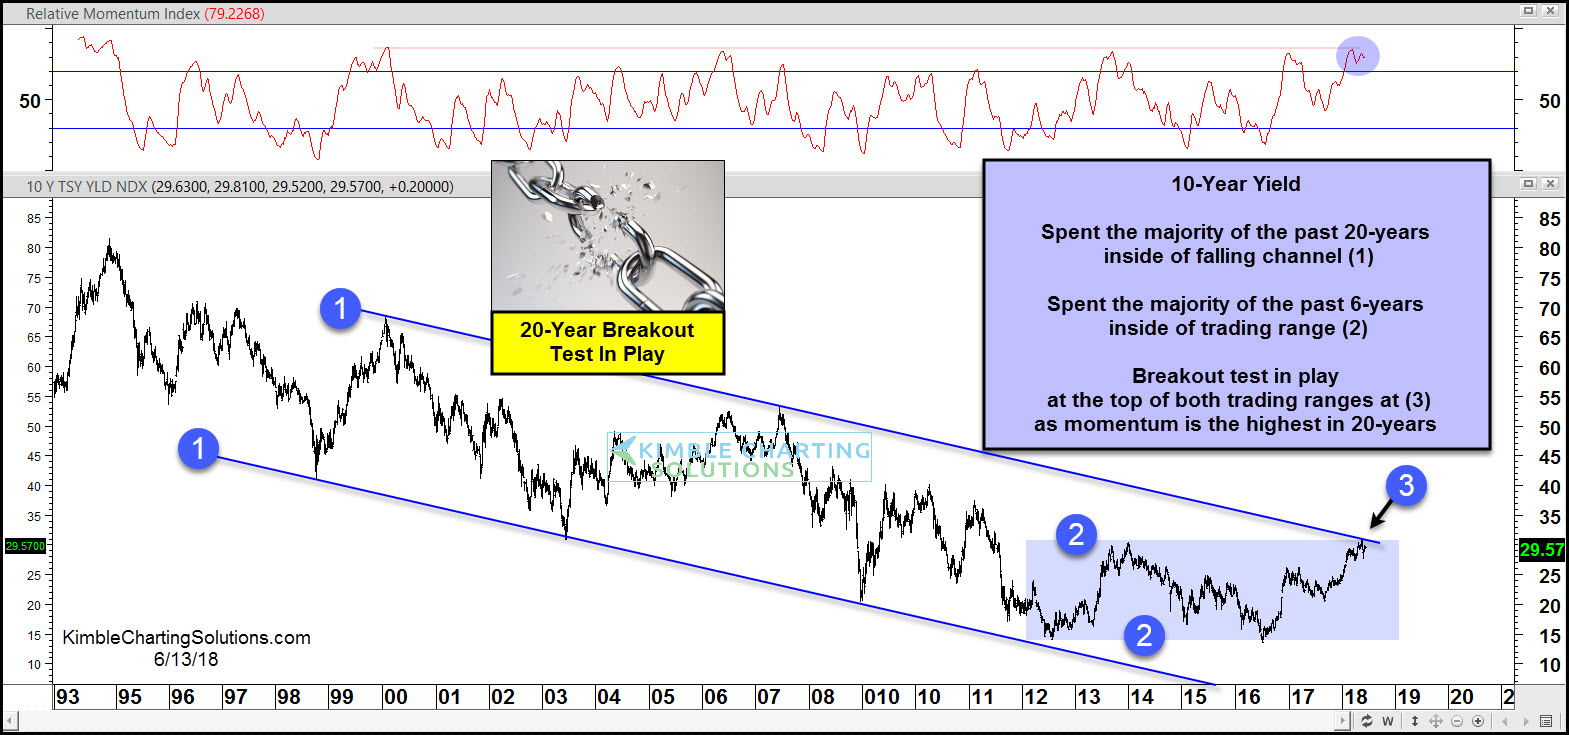
The chart above looks at the yield on the 10-year note (TNX) over the past 25-years. The long-term trend is down as an important trend test is in play currently.
The 10-year yield has spent the majority of the past 20-years inside of falling channel (1). They have also spent the majority of the past 6-year inside of sideways trading channel (2), as rates are currently at the same level they hit in 2013.
Yields are now testing the top of the 25-year and 6-year channels at the same time at (3), with momentum now at levels last seen nearly 20-years ago.
One thing for sure is this….Bond bulls do not want to see dual resistance break at (3), as it would signal a major trend change in rates.
Will it be different this time for rates? Rates are testing one of the most important price points in a long, long time, so keep a close eye on what they do at (3)!!!
–
