
With the Federal Reserve in interest rate “hike” mode, the market is on edge about the speed with which rates will rise.
Rates have been rising at a pretty steady clip over the past couple of years… and apparently, it’s getting investors attention!
In fact, the past two years have seen Treasury yields rise at the fastest clip in 20 years! More on that below. The current rally has the key 10-year treasury yield (TNX) testing important downtrend resistance. This resistance line is highlighted on both charts in today’s 2-pack.
First we look at a long-term “Weekly” Chart (see below). The Rate Of Change (ROC) indicator shows yields up 82% vs 2 years ago… this marks the biggest 2-year rally investors have seen during the last 20 years.
At the same time, the 10-year yield is testing important dual resistance marked by the falling downtrend line and the December 2013 highs.
Are we due for a breather? Keep an eye on current levels! A breakout here would have important implications for portfolio managers.
$TNX 10 Year U.S. Treasury Yield “Weekly” Chart

CLICK ON CHART TO ENLARGE
Next, we look at a long-term “Monthly” chart.
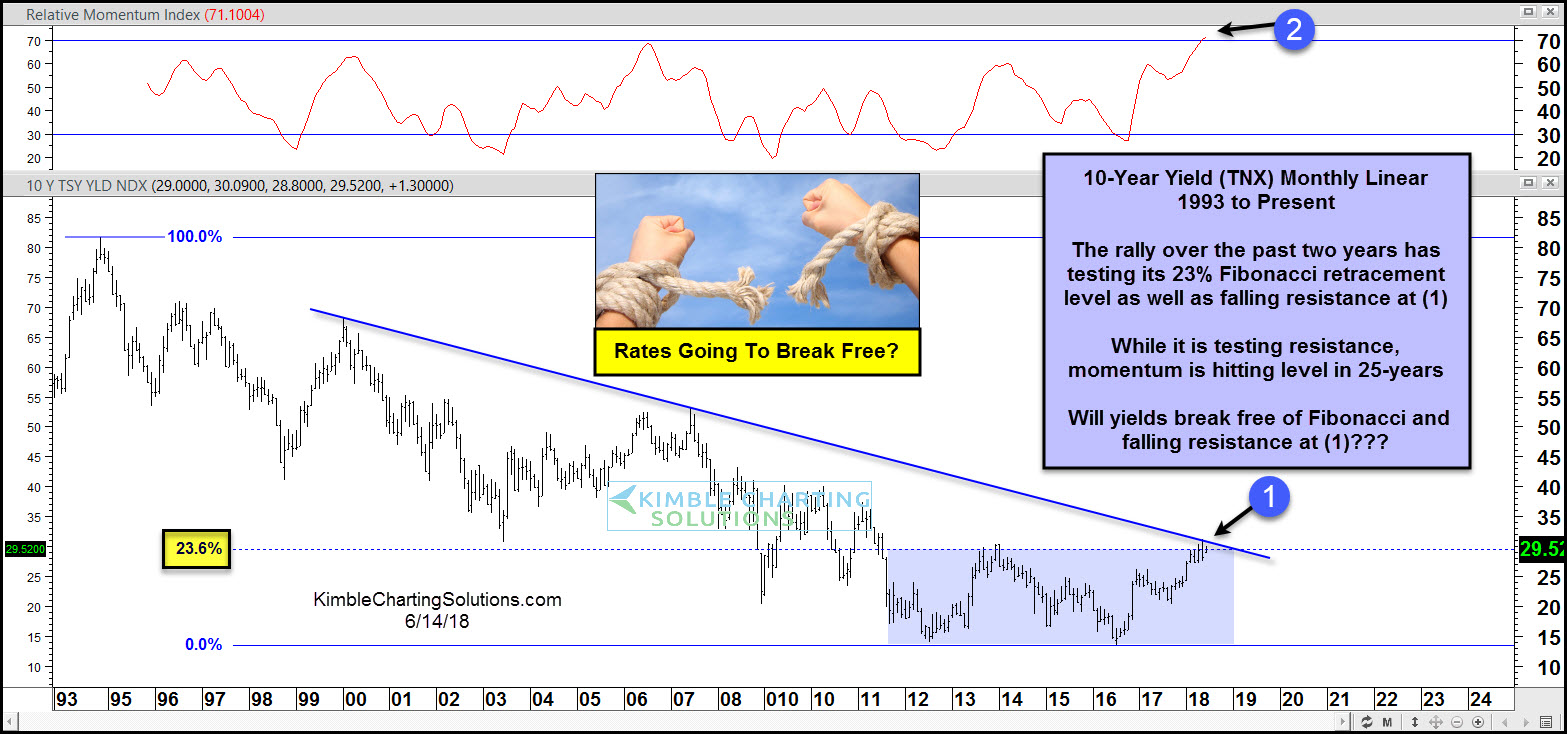
In this chart, we highlight the third level of resistance, marked by the 23.6% Fibonacci retracement of the 1993 highs to recent lows – see the point (1). Note how this Fib level coincides with the downtrend line and lateral resistance. This is a big spot for yields!
It’s also worth noting that we are also seeing an overheated momentum indicator (2). With momentum at 25-year highs, it’s quite possible that rates take a breather here before moving higher. Either way, investors need to pay attention.
$TNX 10 Year Treasury Yield “Monthly” Chart
CLICK ON CHART TO ENLARGE
This post was originally written for See It Markets.com. To see original post CLICK HERE
–
