
On Monday, we highlighted an important price pattern in the chart of the Thomson Reuters Equal-Weighted Commodities Index. Today, we’ll stick within that theme and look at two soft commodities trading setups: Coffee and Sugar (futures).
In both cases, we have charts that have followed downtrends into key long-term support, then bounced. However, the current stage of the bounce is different for each.
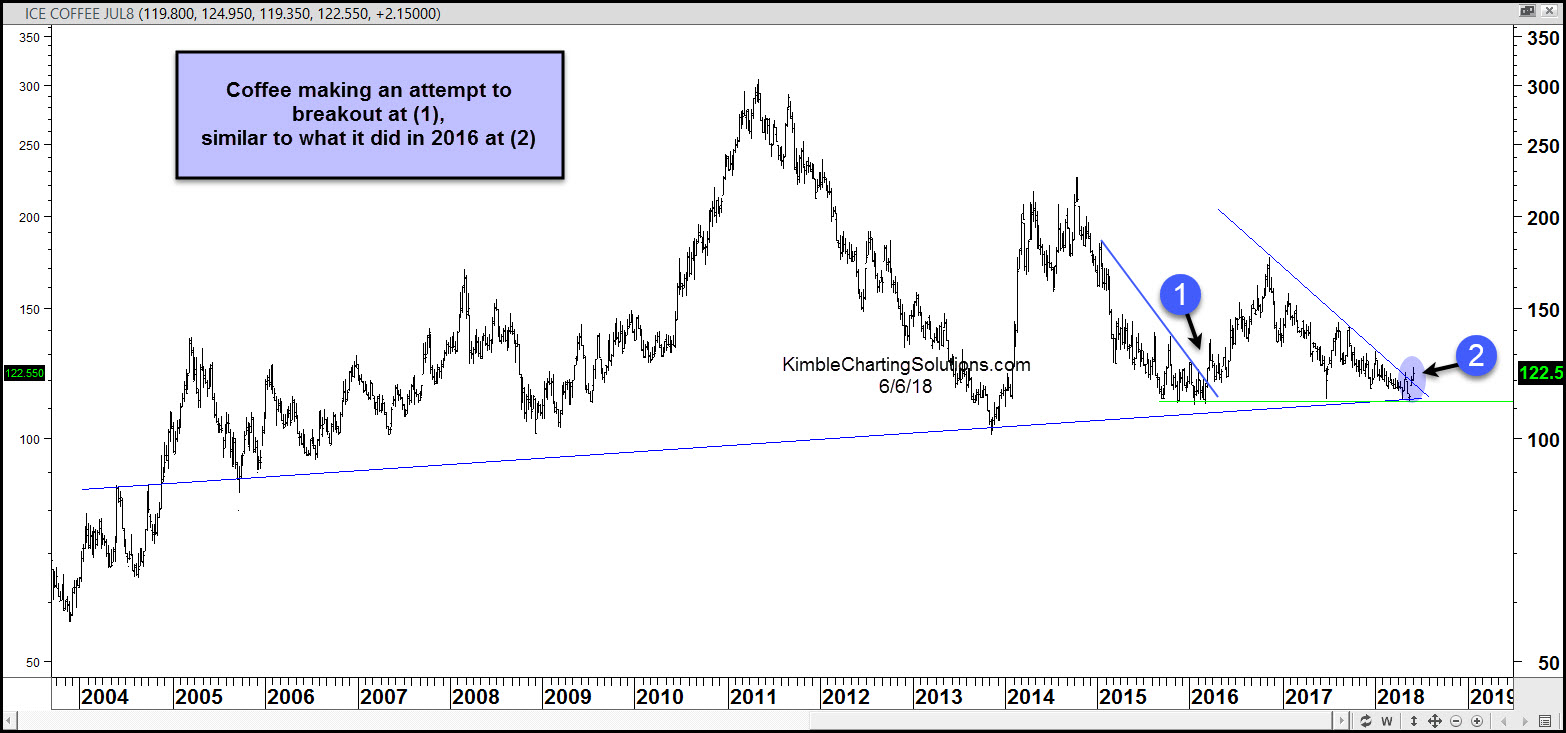
Let’s start with coffee. This chart shows a nice bullish intermediate-term setup. Similar to 2016 (1), coffee bounced off long-term support before testing and breaking out above its falling downtrend line (2). Will this breakout pattern produce another nice rally? The first pullback will be important to watch…
Coffee Futures Long-Term “Weekly” Chart
CLICK ON CHART TO ENLARGE
Looking at sugar, we have a short-term rally out of a deeply oversold state. The trend is still down, as this one has yet to break out. However, that may change soon. It is currently testing its falling downtrend resistance line (1) and could attract some buyers IF its able to break out above point (1).
Stay tuned!
Sugar Futures Long-Term “Weekly” Chart

CLICK ON CHART TO ENLARGE
This post was originally shared on See It Markets.com. To see original post CLICK HERE
