
CLICK ON CHART TO ENLARGE
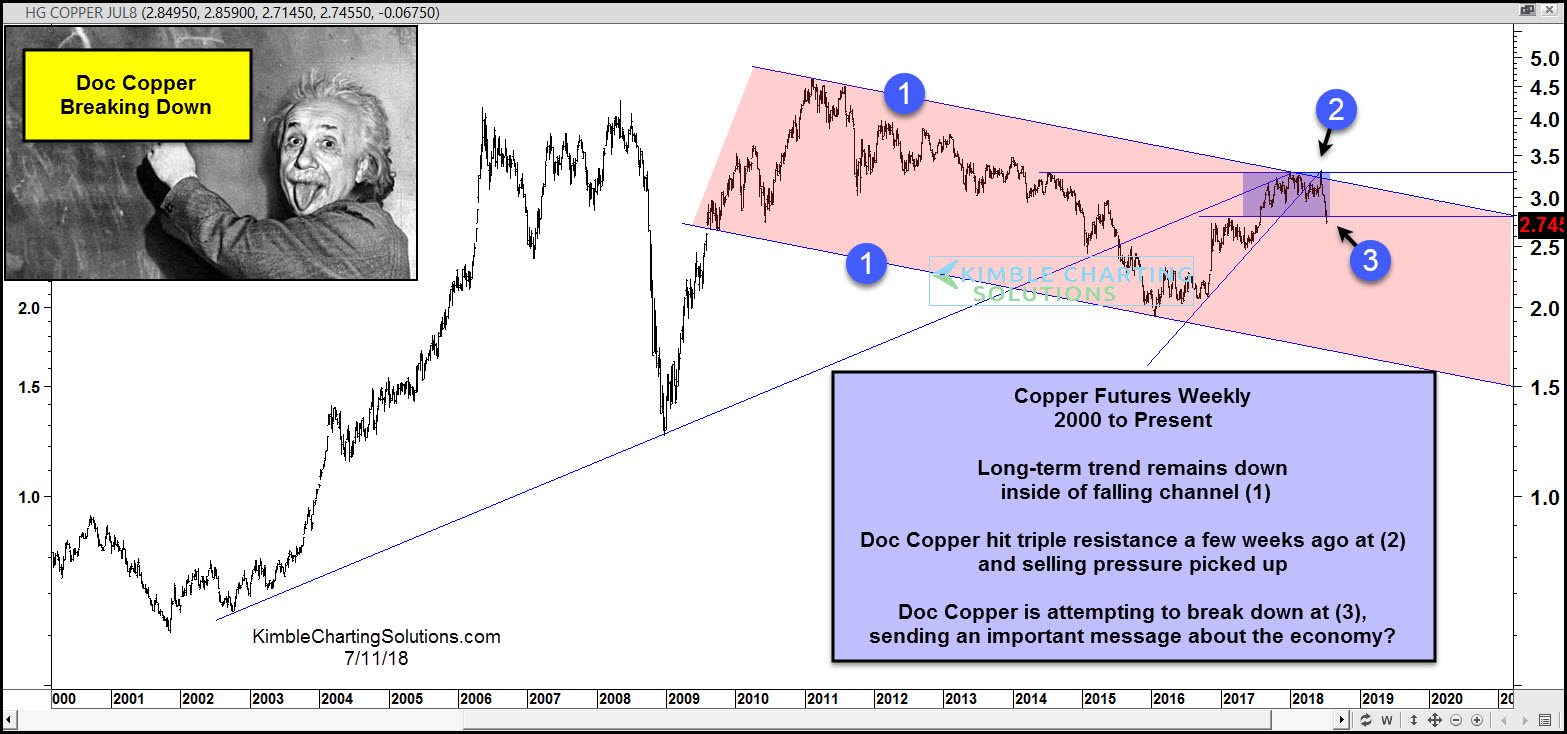
Some view Doc Copper as an indicator of economic strength. If you are in this camp, it is facing an important price point.
Doc Copper remains in a long-term downtrend; as it peaked in 2011 and has created a series of lower highs and lower lows inside of falling channel (1). It hit the top of this falling channel and two other resistance lines a few weeks ago at (2) and the 2-year rally stopped at that time.
The recent sell-off now has Doc Copper attempting to break below support at (3). If Doc Copper continues to head south, it could be suggesting that interest rates and commodities are near short-term highs.
–
