
CLICK ON CHART TO ENLARGE
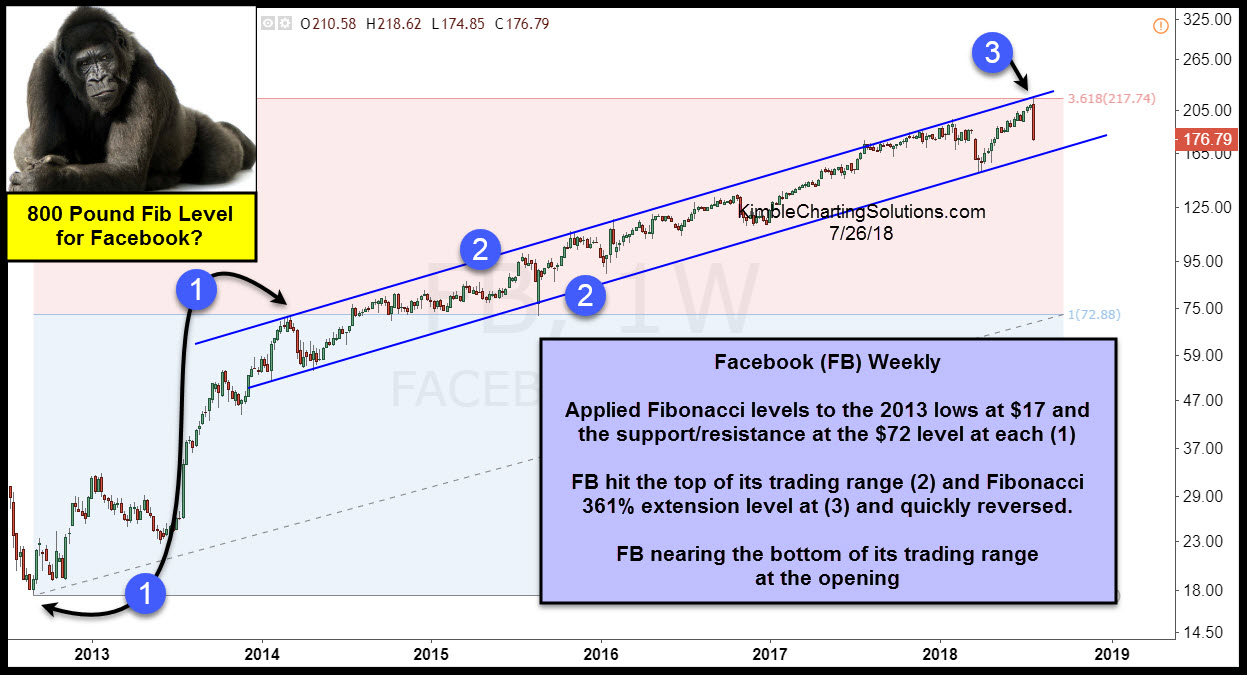
This chart looks at Facebook (FB) since its IPO back in 2012.
Since 2014, FB has remained inside of rising channel (2), where it hit the top of the channel and its Fibonacci 361% extension level earlier this week at (3).
The combo of the Fib extension level and the rising channel looks to be an 800-pound resistance test.
The sharp decline at the opening has FB nearing 4-year rising channel support. To test channel support, it would need to decline to the $165 zone.
–
