CLICK ON CHART TO ENLARGE
Could major indices in the states be impacted by what happens in Japan over the next couple of months? Sure could!
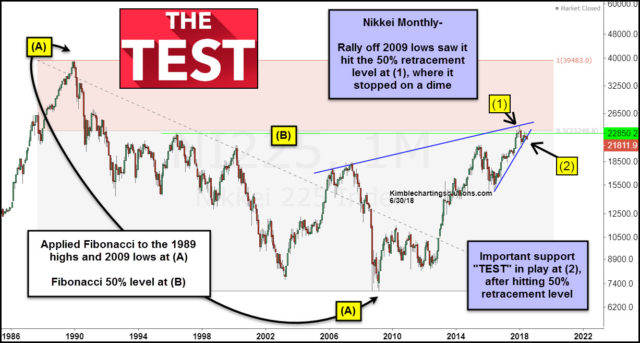
The chart above looks at the Nikkei index over the past 30-years on a monthly basis. Two of the most important turning points over the past three decades took place at 1989 highs and 2009 lows, at each (A). We applied Fibonacci retracement levels to these extremes and those important price points could be impacting the price action of the Nikkei of late, as well as indices in the states.
The Nikkei hit the 50% level at the end of last year at (1). While kissing the underside of this important Fib level, it created a large monthly bearish reversal pattern.
Did this key index peak at the start of the year and the S&P and Dow peak one month later??? Until upside breakouts in the Nikkei, Dow, and S&P take place, it would appear so at mid-year!
Weakness since the first of this year now has the Nikkei testing 2-year rising support at (2). Stock bulls in Japan and the states might want to keep an eye on the Nikkei as a very important “Support Test” is in play at this time.
–


