
CLICK ON CHART TO ENLARGE
Doc Copper has had a rough go of it over the past 7-years and especially of late.
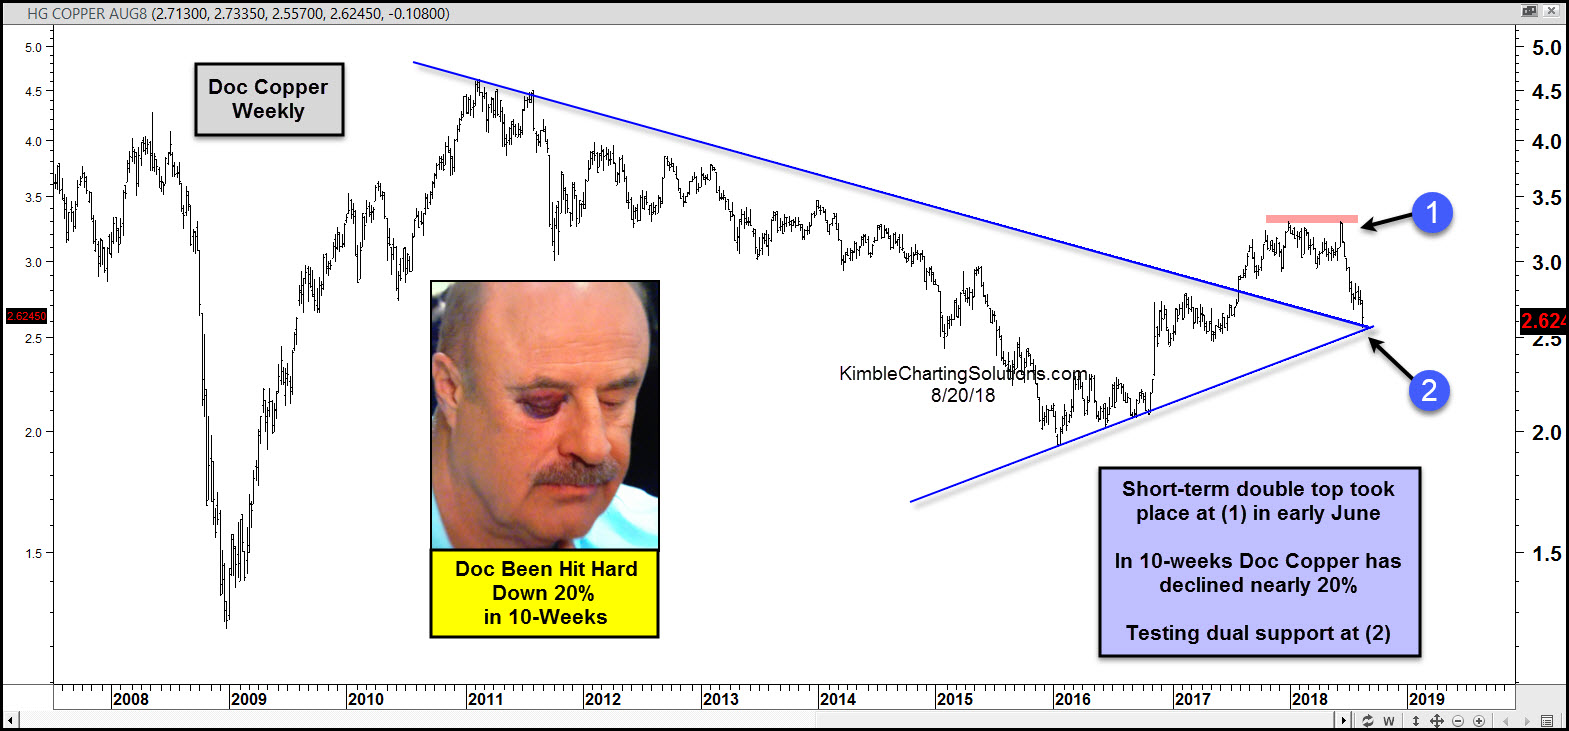
Since the highs back in 2011, Doc Copper has created a series of lower highs and lower lows.
Since the lows in 2015, it has experienced a strong rally, creating a series of higher lows, as interest rates and several commodities did the same.
In June Doc Copper may have created a double top at (1), as it was testing last years highs. Since hitting 2017 highs at (1), Doc Copper has declined nearly 20% in the past 10-weeks.
The decline now has it testing potential dual support at (2).
What Doc Copper does at (2) could send an important macro message to commodities, bonds and stocks around the world! Keep a close eye on what Doc Copper does the next few weeks at (2), as it could be very important!
–
