
CLICK ON CHART TO ENLARGE
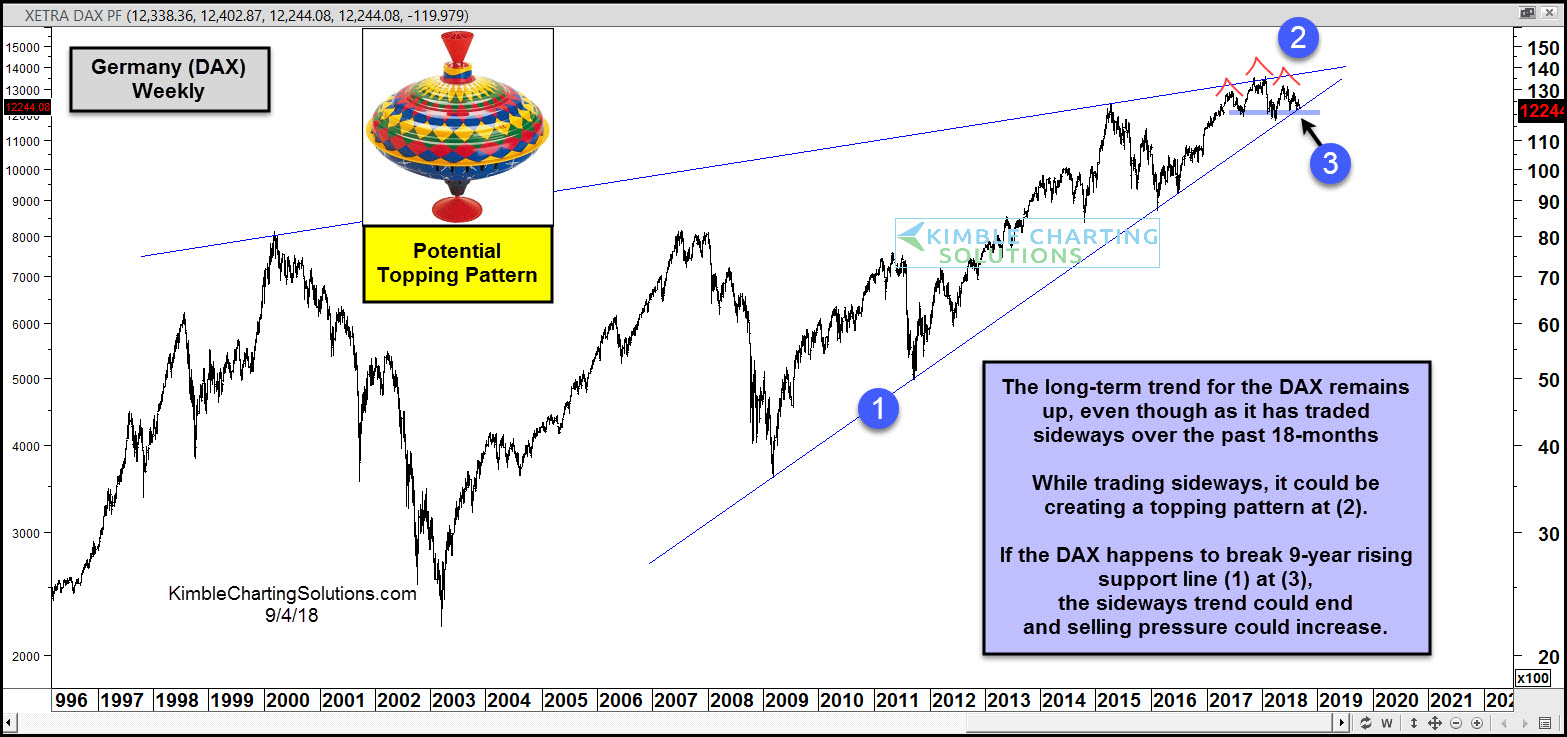
This chart looks at the DAX index from Germany over the past 20-years. As mentioned above, even though this important index has traded sideways for the past 18-months, its long-term trend remains up.
While the DAX has been trading sideways for the past year and a half, it could be creating a head & shoulders topping pattern at (2).
The softness in the index has it currently testing the bottom of its trading range and 9-year rising support line (1) at (3).
Bottom line-One of the most important support tests in nearly a decade is in play at (3) for the DAX. If this support breaks it will have an important influence on other indices in Europe and potentially stocks in the states.
–
–
