
After navigating an early year stock market correction, investors have seen the S&P 500(NYSEARCA: SPY) climb back to new all-time highs.
While making new highs is bullish, it’s concerning when it comes with a significant divergence. In this case, it’s a momentum divergence.
And history has shown that while some divergences are ignored for weeks or months, there have been a couple in the past 20 years that have lead to significant declines.
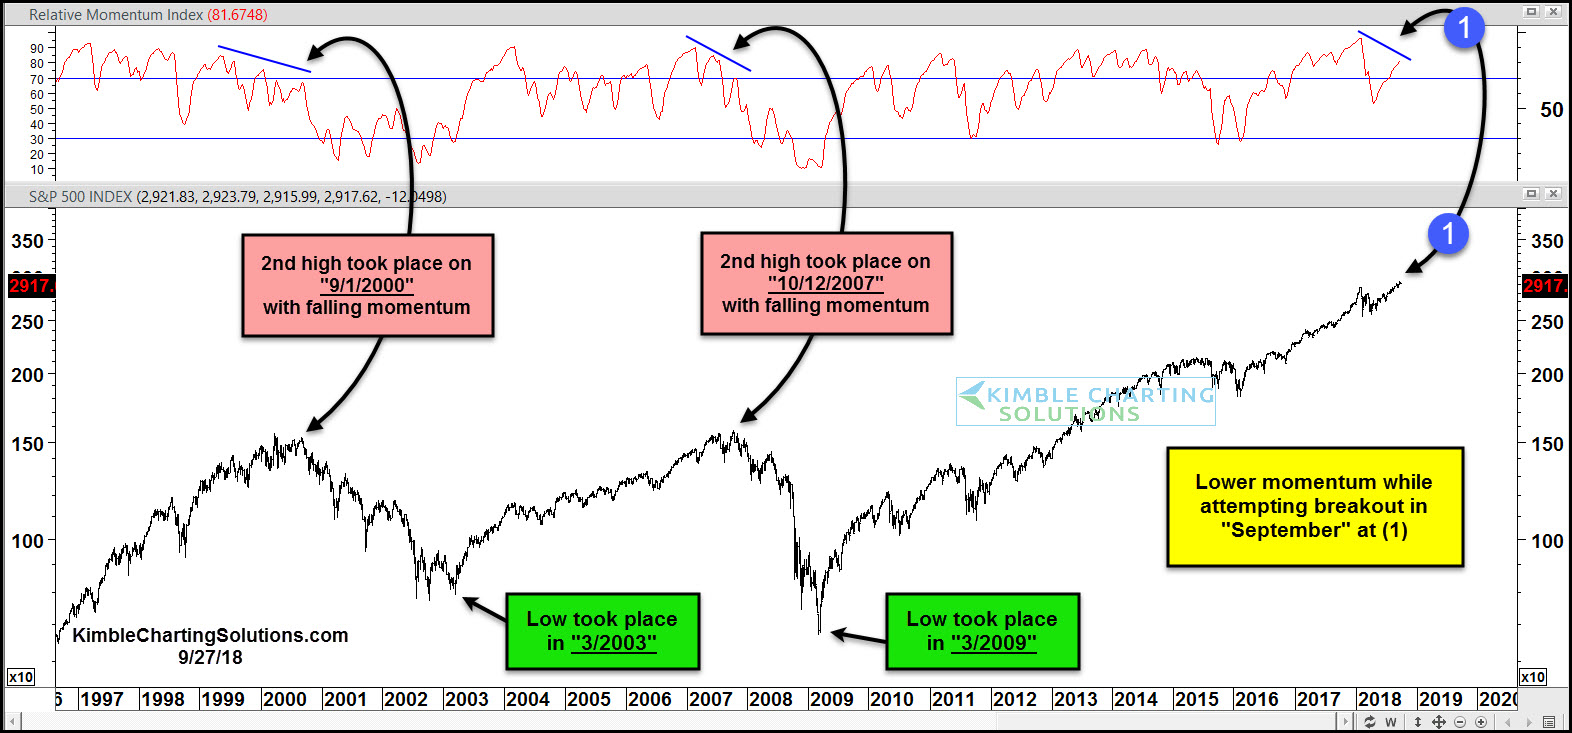
Both of these momentum divergences came when the S&P 500 made a “second high”. See chart below. Looking at the chart below, you can see that while the S&P 500 is trying to breakout in September (and making a second high), it’s seeing a lower momentum reading.
Two notable times we saw divergence patterns and readings like this were September 2000 and October 2007. Yikes! History doesn’t always repeat itself, but it does offer investors a thoughtful reminder of why it’s important to pay attention to risk indicators… and to always have a plan!
S&P 500 “Second” Peaks with Momentum Divergences
CLICK ON CHART TO ENLARGE
The 2000 & 2007 highs took place within weeks of the first day of fall (9/21), as momentum was hitting lower highs. Stock bulls are keeping fingers crossed that it’s different this time!”
This article was originally written for See It Markets.com. To see original post CLICK HERE
