
CLICK ON CHART TO ENLARGE
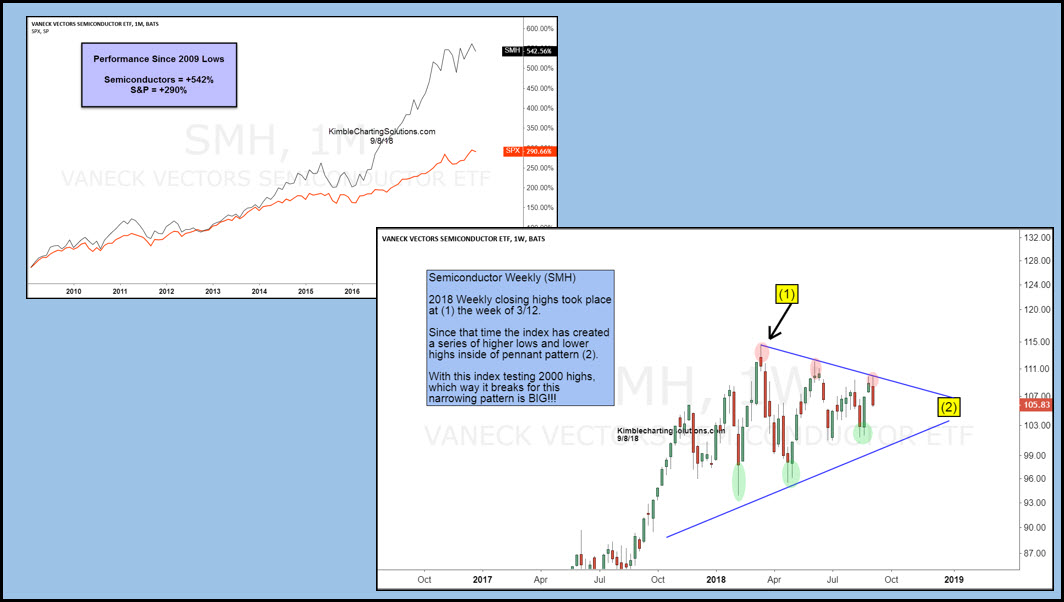
Since the 2009 lows, Semiconductor ETF (SMH) has gained nearly 50% more than the S&P 500 (see upper left chart).
The rally off the 2009 lows has it testing the highs of 2000, as it is creating what looks like a narrowing pennant pattern since the 2018 highs in March.
After hitting the highs 6-months ago, SMH has created a series of lower highs and higher lows inside of pennant pattern (2).
Each of the highs has created bearish reversal patterns (bearish wicks), while the lows have done the opposite (bullish wicks/reversals).
How this leader resolves the narrowing pennant pattern will send an important message to the broad markets! Keep a close eye on SMH in the weeks ahead!
–
