
Interest rates are steadily creeping higher. And housing, as measured by the several housing related ETFs and Indexes is facing a slowdown. And not very many people are talking about it. Well, it’s time to put it on your radar!
Housing carries implications for the economy and the stock market (and our portfolios).
Currently, the Home Construction Index and ETF (NYSEARCA: ITB) have turned lower. The Homebuilders ETF (NYSEARCA: XHB) has turned down. And the broad Real Estate ETF (NYSEARCA: IYR) has been chopping sideways.
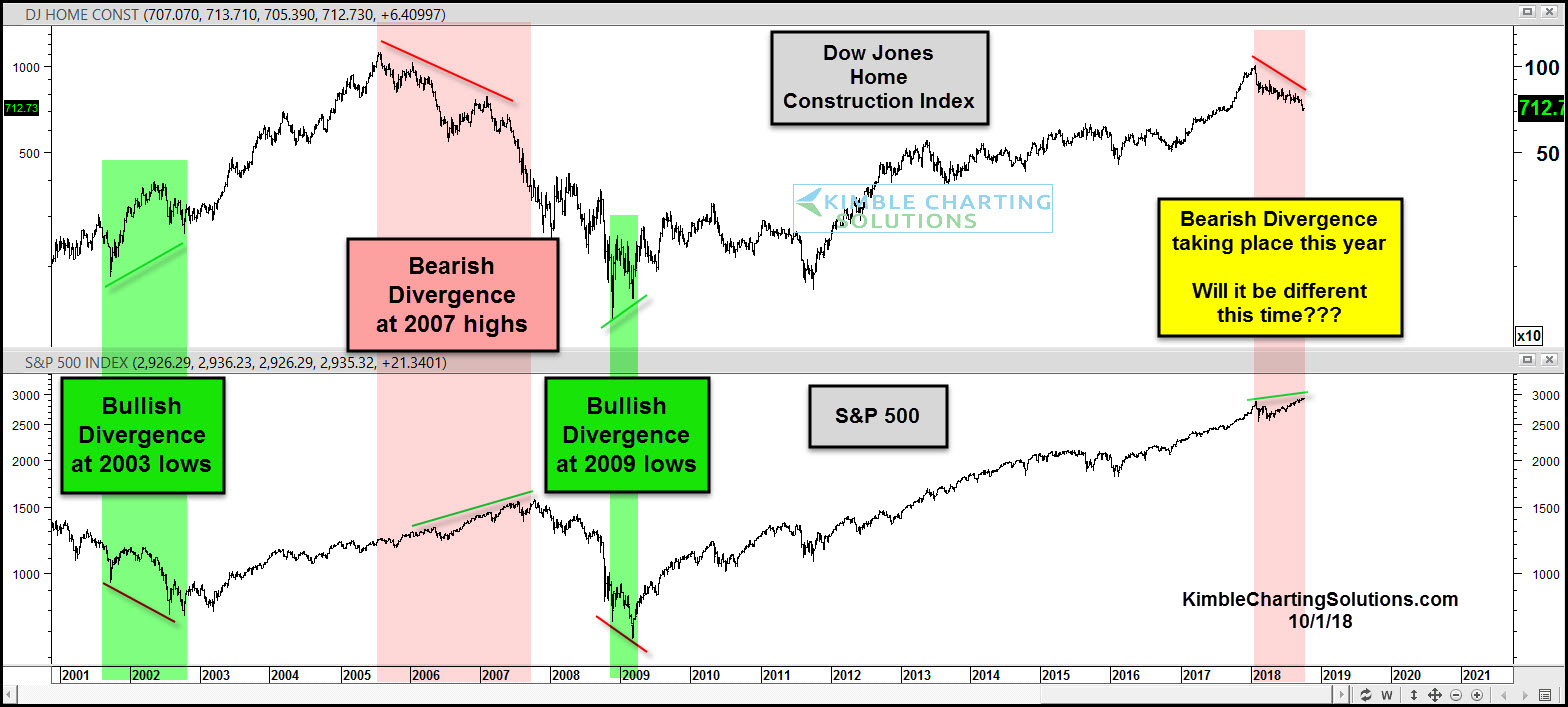
Looking at the chart below, we can see the relationship between housing and the stock market. Major divergences have formed at the last three big turns for the S&P 500.
In 2001/2002 and in 2008/2009, the Dow Jones Home Construction Index began to improve prior to the S&P lows. In mid-2005, the Index turned lower, prior to the 2007 stock market top. And once again we are seeing the Home Construction Index turning down while the S&P 500 is higher.
When will this divergence matter to the equity markets? Will it be different this time?
Dow Jones Home Construction Index vs S&P 500
CLICK ON CHART TO ENLARGE
This article was originally written for See It Markets.com. To see original post CLICK HERE
