
CLICK ON CHART TO ENLARGE
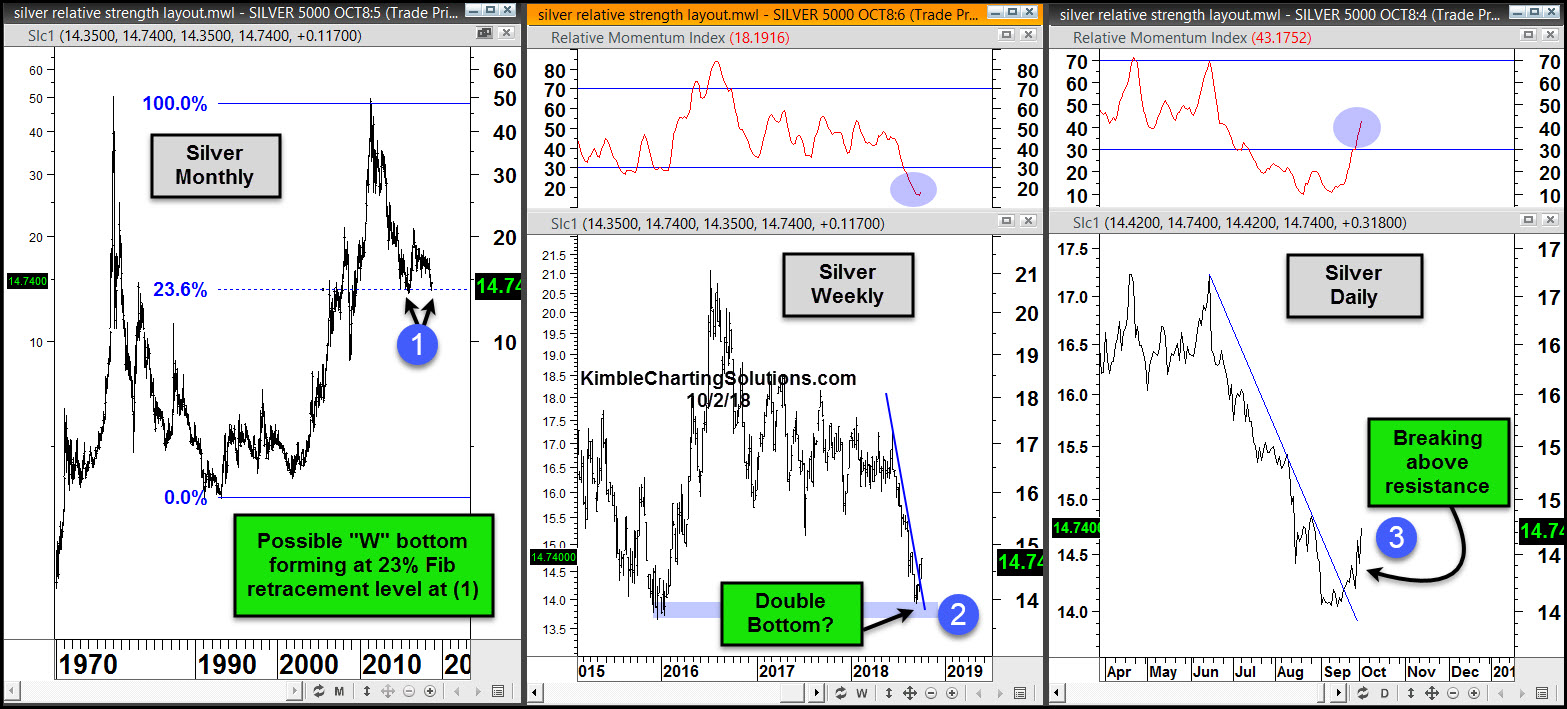
Is Silver creating a double bottom and breaking above key resistance levels? Could be!
This 3-pack looks at Silver at three different time frames. The left chart looks at Silver on a “Monthly” basis since late 1970’s. The middle chart looks at Silver on a “Weekly basis” over the past three years and the right chart looks at Silver on a “Daily basis” for the past 6-months.
The monthly chart highlights that the decline from the 2011 highs is testing the 23% Fibonacci retracement level based upon the 1993 lows and 2011 highs. Silver could be creating a double bottom while testing the 23% level at (1).
The weekly chart reflects that Silver is testing the 2015/2016 lows at (2), as momentum is the most oversold in years.
Silver is attempting to break above steep falling resistance on a daily basis at (3), as oversold momentum is attempting to turn higher.
No doubt the long-term trend in Silver remains down. The Power of the pattern is keeping a close eye on this hard hit asset, as it could be attempting to create a tradable opportunity due to these patterns.
We believe opportunities are in play in the Gold, Silver, and miners markets. If you would like to take advantage of them, our Metals report may be just what you are looking for!
–
