CLICK ON CHART TO ENLARGE
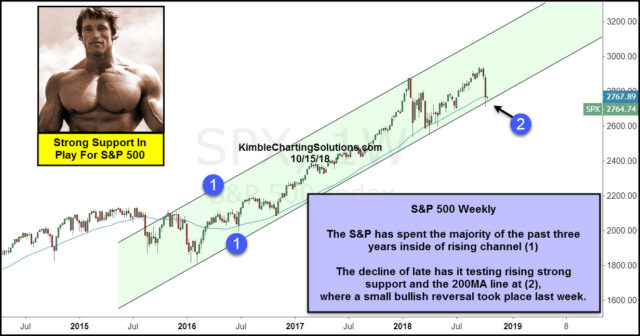
This chart looks at the S&P 500 on a weekly basis over the past couple of years. Since the start of 2016, the S&P has spent the majority of the time inside rising channel (1).
In January the S&P hit the top of the rising channel and selling quickly took place, taking it down to test rising support in a matter of a couple of weeks.
The softness of late has the S&P facing rising channel support and its 200-day moving average at (2).
CNN Fear & Greed Index-
CLICK ON CHART TO ENLARGE
The S&P’s upward trend remains in play until it breaks below rising channel support and its February lows.
–


