
CLICK ON CHART TO ENLARGE
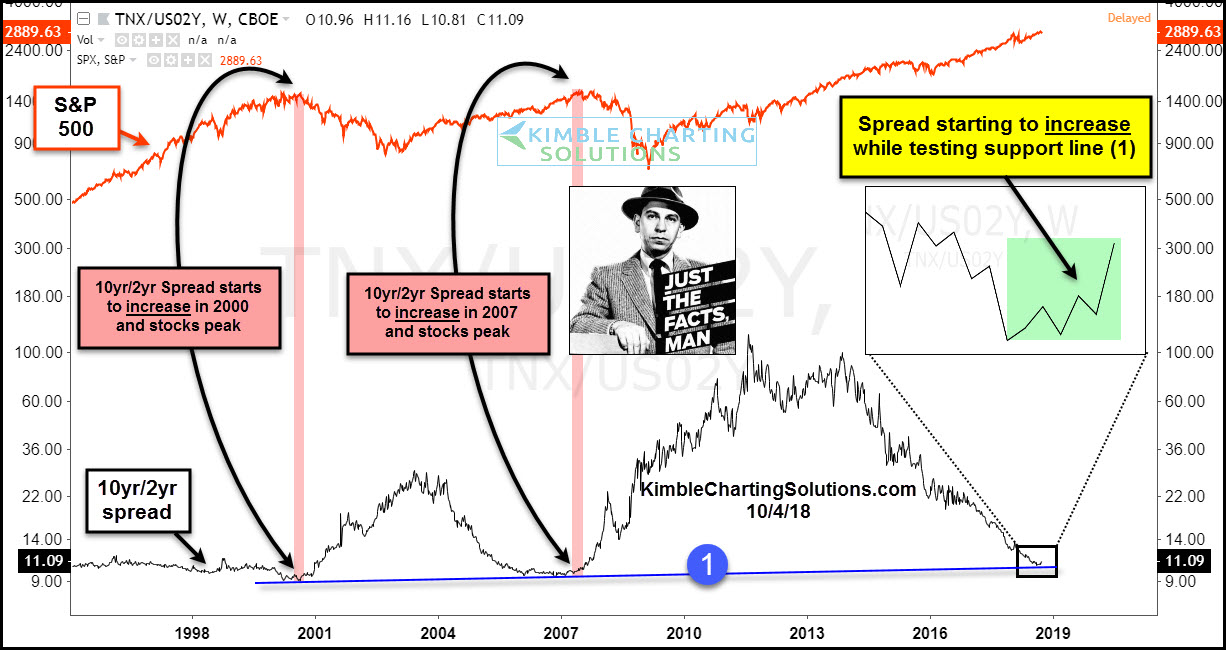
This chart compares the spread between the 10-year yield and the 2-year yield to the performance with the S&P 500. Even though this indicator is based up government bond yields, it has proven to help stock investors know when to be overweight and underweight stocks.
When the spread was very low in 2000 & 2007 and turned up, the S&P was very near an important peak in prices.
Joe Friday Just The Facts– The spread is near 2000 & 2007 support line (1) and is attempting to turn up of late. If the spread continues to move higher, will stocks peak again or is it different this time?
–
