
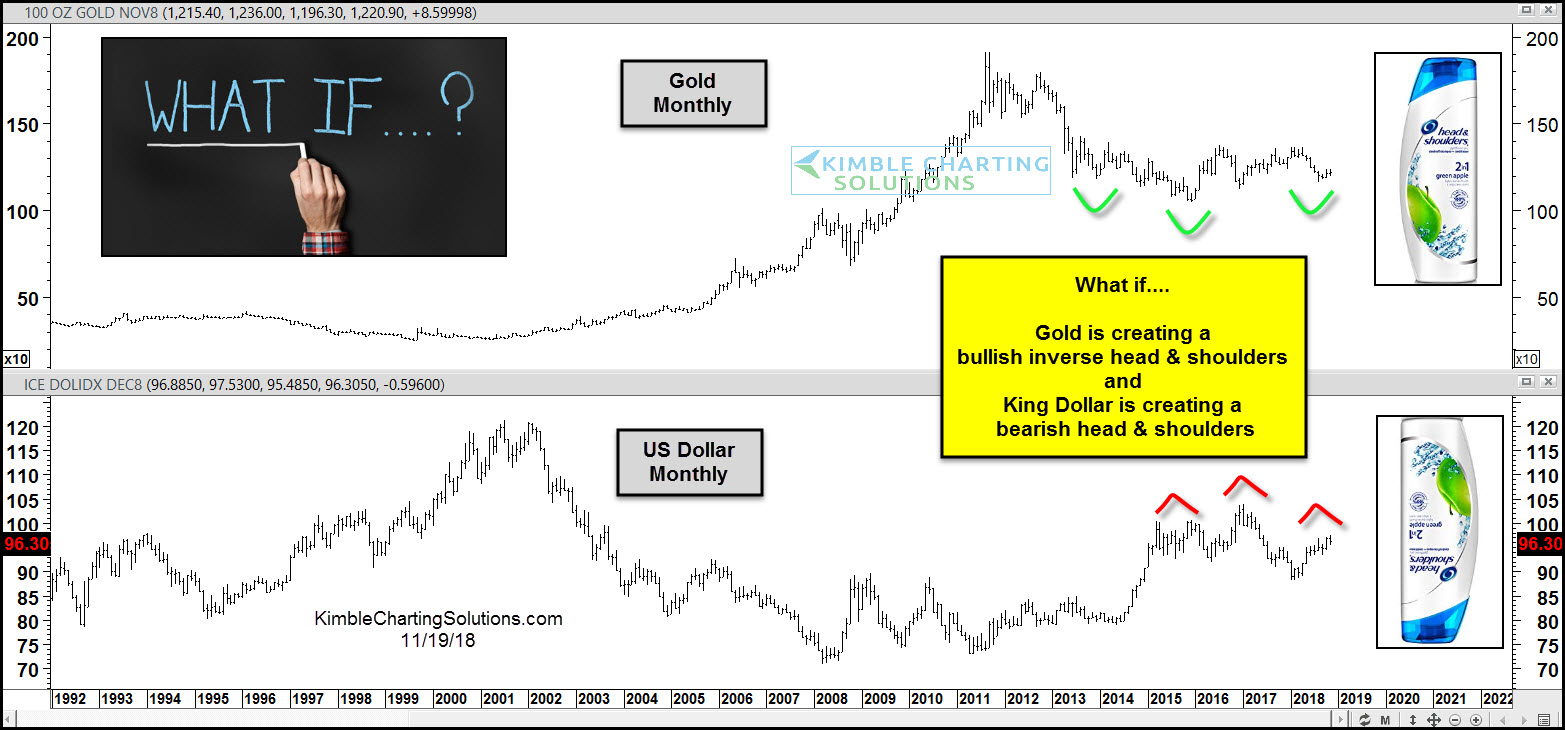
Last week I pointed out a potential top on the US Dollar / Gold ratio. That would be bullish for gold bugs. This week, I have another potentially bullish setup to show you.
As most of you are aware, any weakness in the US Dollar is good for gold prices. In the chart 2-pack below, we look at Gold and the US Dollar Index on a monthly basis.
Gold (NYSEARCA: GLD) is attempting to form a bottoming base in the form of an inverse head & shoulders pattern. At the same time, the U.S. Dollar is forming a potential head and shoulders topping pattern.
Perhaps it’s too obvious… but traders should pay attention to these patterns and how they play out!
Gold vs US Dollar Chart – Head & Shoulders Patterns?
CLICK ON CHART TO ENLARGE
This article was first written for See It Markets.com. To see original post CLICK HERE
–
