
Tech is doing something this month that it hasn’t done in 9-years, which could be sending an important message to the broad markets.
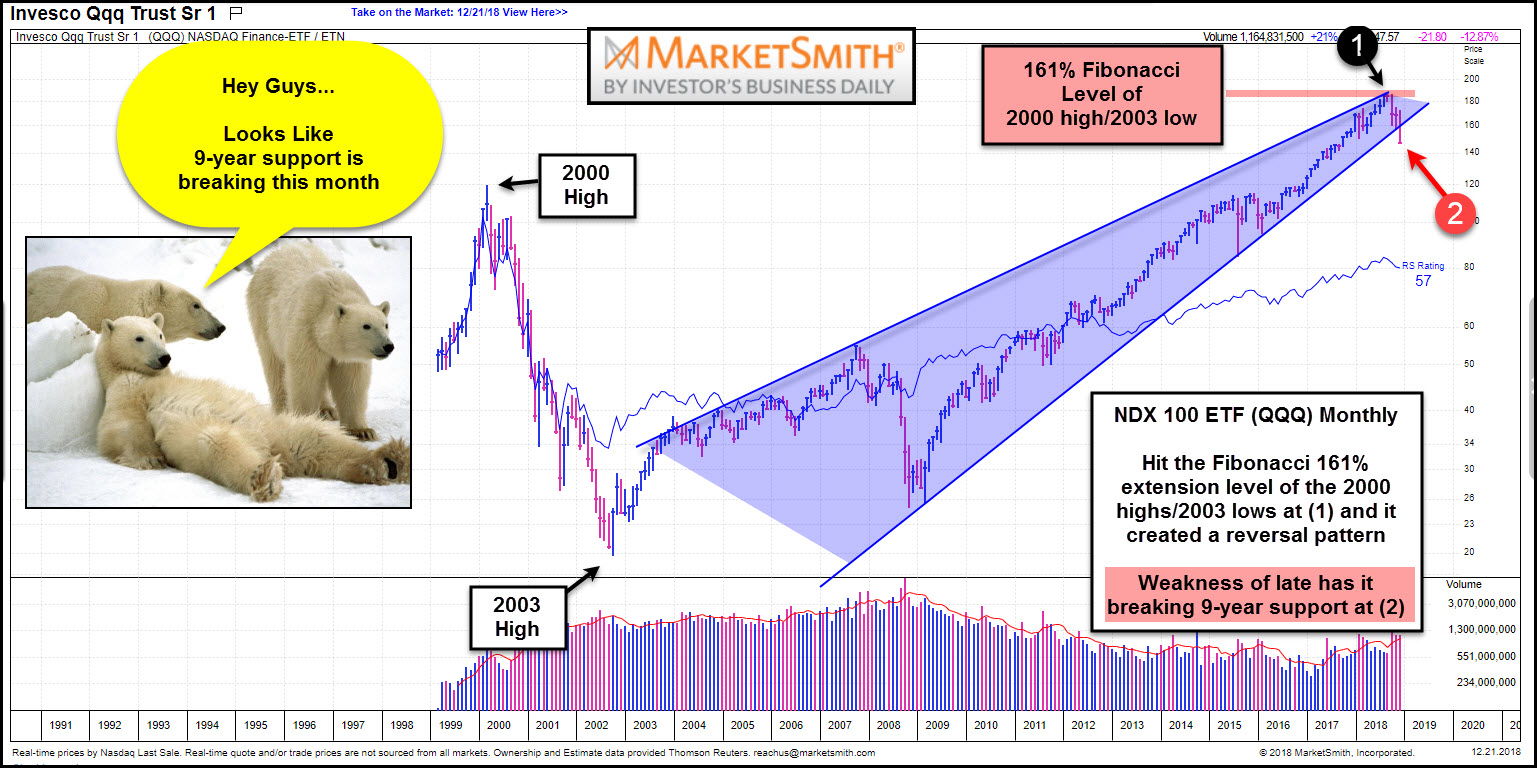
This chart from Investors.com and Marketsmith looks at the Nasdaq 100 ETF (QQQ) on a monthly basis since inception. We applied Fibonacci levels to the 2000 highs and 2003 lows, which highlights that QQQ hit the 161% extension level at (1) in September. While hitting the 161% level, it was also kissing the underside of resistance and it created a bearish reversal pattern.
Weakness since hitting the 161% level, now has QQQ breaking 9-year rising support at (2). This break of support sends a negative message to the broad market, from this sector that has been an upside leader since the 2003 lows!
–
