
The NYSE Composite (NYA) is testing the bottom of its 12-month trading range this month. In fact, it’s breaking down and out of it… it’s sink or swim time.
Will this be a quick undercut and reversal? Or the start of a deeper correction/bear market? Bulls need to reverse this right now, or it could be a long winter.
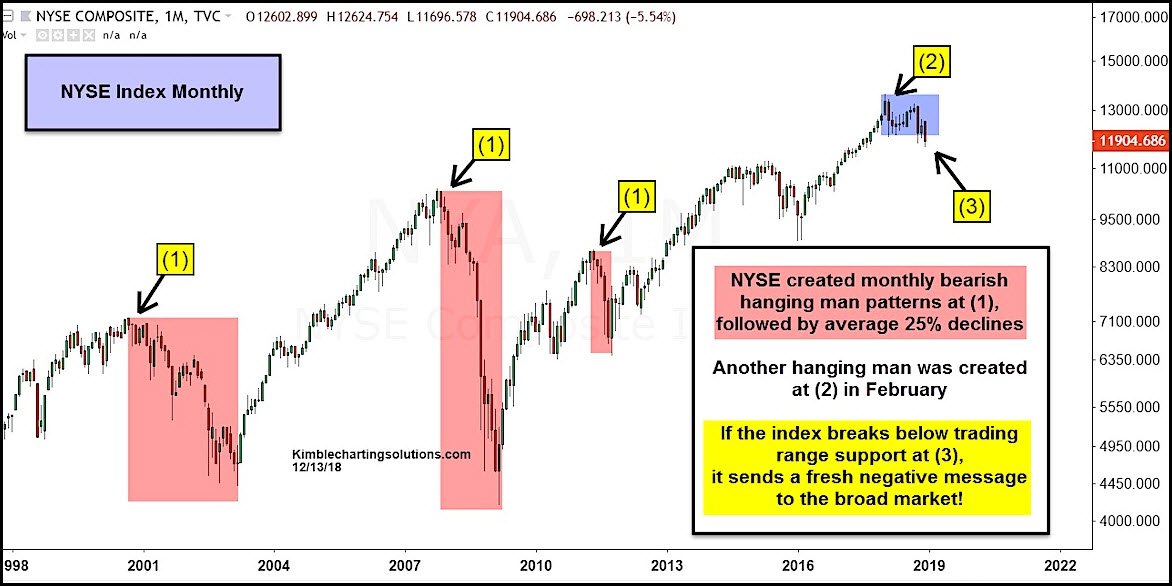
Looking at the chart below, we can see that the NYSE composite formed bearish hanging man patterns at (1) multiple times over the past two decades. The ones highlighted were followed by an average 25% decline.
Another hanging man candlestick was formed back in February at (2). This lead to the initial stock market correction early this year. The broad stock index developed a trading range thereafter (blue shaded area). BUT, as mentioned at the beginning of this post, the NYSE is currently attempting to break down through that support at (3).
Follow through selling would send a bearish message to investors.
NYSE Composite Chart
This article was first written for See It Markets.com. To see original post CLICK HERE
–
