
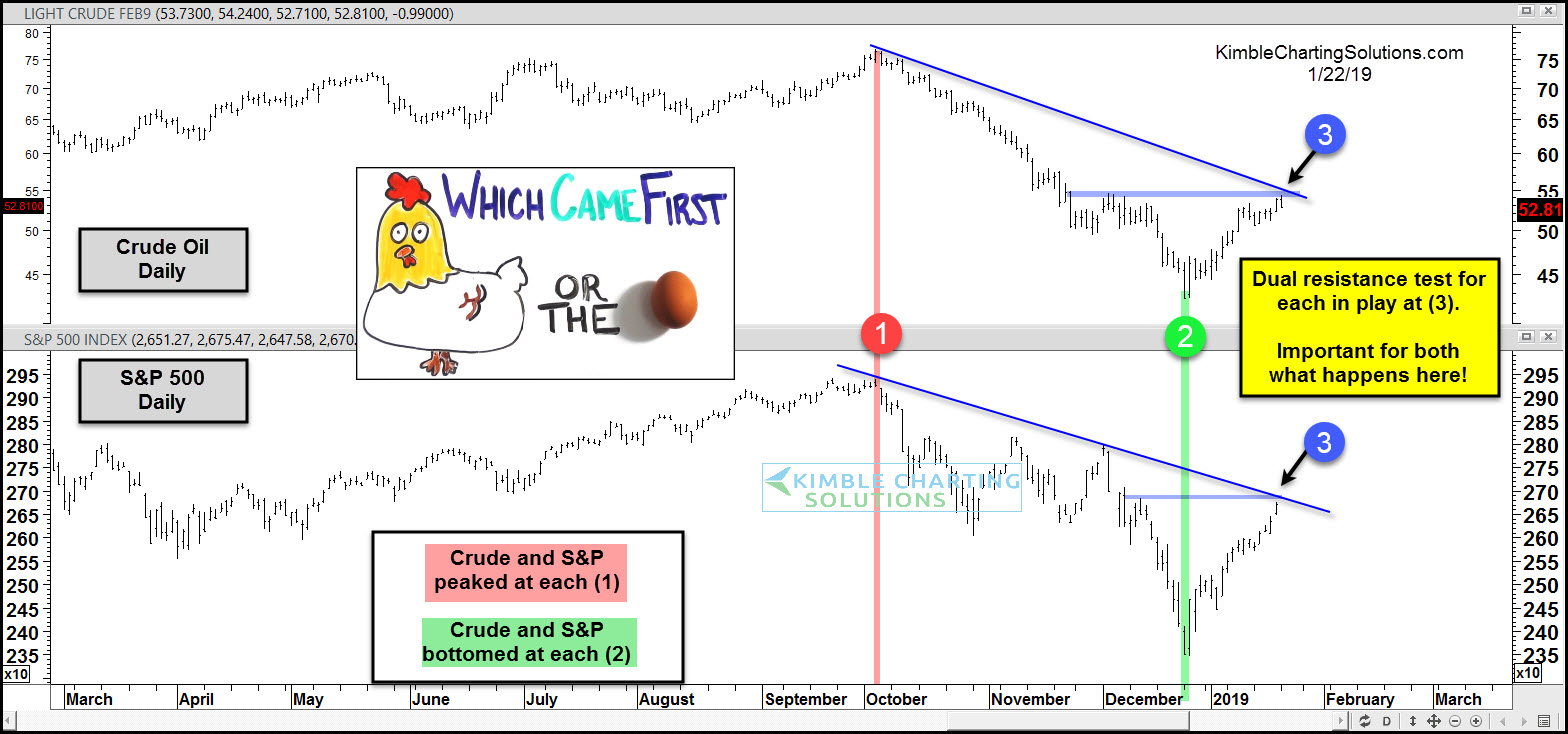
The correlation between Crude Oil and the S&P 500 has been rather high over the last 100-days, as each looks to have peaked at the same time around the 1st of October at (1).
After peaking together in October, Crude fell over 40% and the S&P nearly declined 20%, with both bottoming on Christmas Eve at each (2).
Both have experienced counter-trend rallies since the lows, as Crude is up 23% and the S&P 13%.
These rallies have both testing dual resistance at each (3), as each has created a series of lower highs over the past 100-days.
Will this resistance hold or will very important counter-trend breakouts take place at (3)? What these two assets do at (3), should go a long way to telling us where they end up at months end and beyond!
–
