
Is the rally of late about to run out of steam or is a major breakout about to take place in the S&P 500? What happens at current prices should go a long way in determining this question.
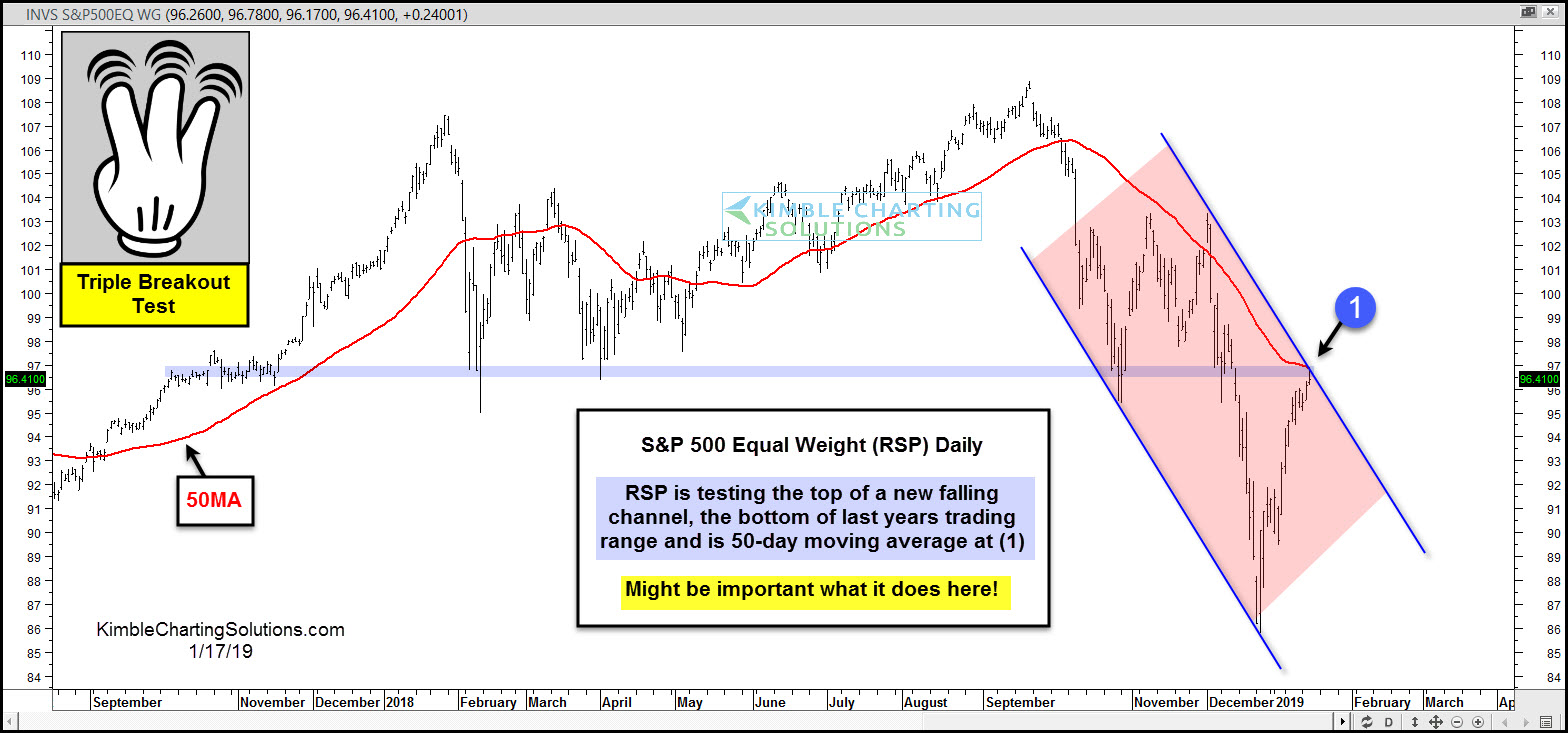
This chart looks at the equal weight S&P 500 ETF (RSP) on a daily basis over the past 15-months.
The rally from the lows on Christmas Eve has RSP testing the top of a newly formed falling channel while testing the underneath side of the 2018 trading range and its falling 50-day moving average at (1).
At this time RPS is facing a triple resistance test. Will it succeed in breaking out of this key price zone?
A very important triple breakout test is in play for RSP! What it does here most likely will give us a clue to the next big move in the broad markets!
–
