
The first fact of the day; The long-term trend for tech remains up and the decline into the lows on Christmas Eve DID NOT break this trend!
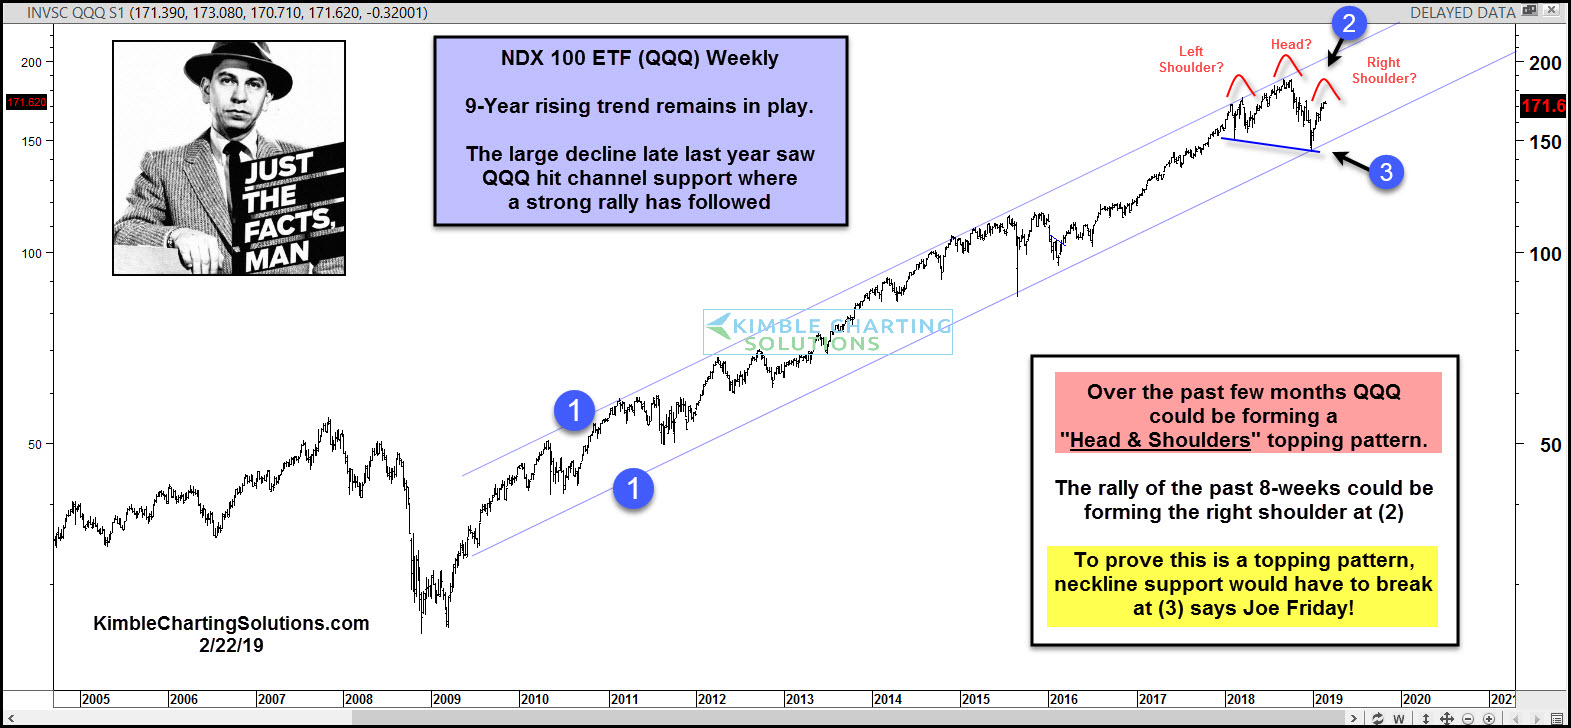
This chart looks at NDX 100 ETF (QQQ) on a weekly basis over the past 14-years. For the past decade, since the lows in late 2009, QQQ has remained inside of rising channel (1). As you can see the decline into the end of the year lows, did nothing more than test support, which held and a strong rally has followed!
Over the past few months, QQQ could be forming a “Head & Shoulders” topping pattern. It’s possible the 8-week rally off of 10-year rising support is forming a right shoulder.
Joe Friday Just The Facts Ma’am- Is a giant a topping pattern is in play? QQQ would need to break the neckline and rising channel support at (3), to prove that an important topping pattern has been completed!
What would prove this pattern is a bust? Nothing more than a rally above the left shoulder highs and a break above last years highs!
–
