
For the past 5 years, Gold prices have traded sideways. There were plenty of “trades” to be made, but that type of price action tends to grind out long-term bulls and bears.
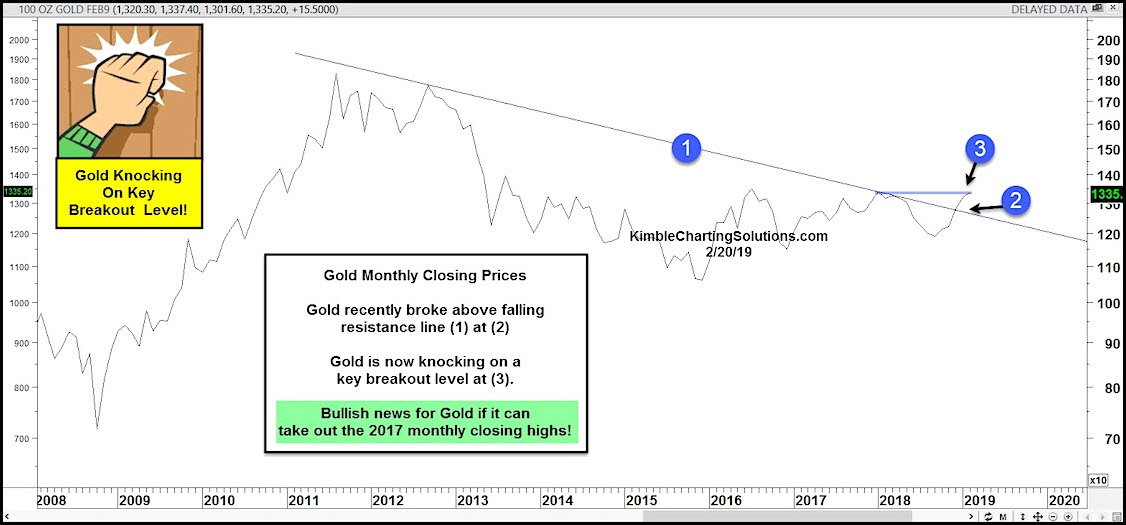
You can see this in today’s “monthly” closing chart for Gold (shown below).
Gold bulls caught a break recently when Gold broke out above its multi-year downtrend line at (1) and (2). This spurred a big advance in metals & mining stocks.
Can Gold bugs and bulls keep the momentum going? We should find out shortly.
Gold is currently knocking on a key breakout resistance level (3). A bullish message will be sent to bulls if Gold can breakout above the 2017 monthly closing highs!
This article was first written for See It Markets.com. To see original post CLICK HERE
–
