
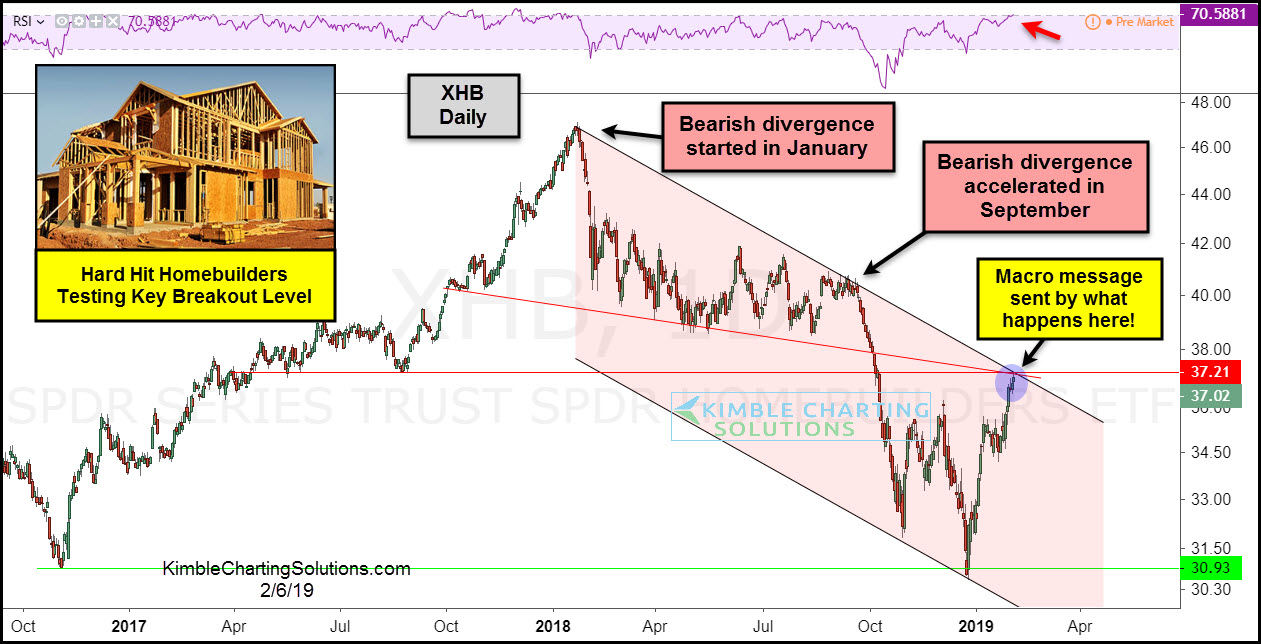
Housing and home building related stocks have been hit hard over the past year. Case in point: The Homebuilders ETF (NYSEARCA: XHB).
Looking at the chart below, it’s clear that the Homebuilders (XHB) have been in a downtrend since last January of last year (see pink shaded area). The downtrend started with a bearish divergence and accelerated with another bearish divergence in September of last year. This lead to the December lows.
The current rally has carried XHB up into a critical breakout level. This level is made up of a key confluence of lateral and trend line resistance.
What happens here will send an important message about the economy to the stock market.
The bullish case for the economy and stocks is a breakout here. BUT the bullish case will receive a concerning canary message if heavy selling takes place at this key resistance level.
This article was first written for See It Markets.com. To see original post CLICK HERE
–
