
When the financial media talks about US Treasuries, it is usually focused on the yield curve. Or sometimes they will highlight the 10-year treasury yield and its relation to mortgage rates.
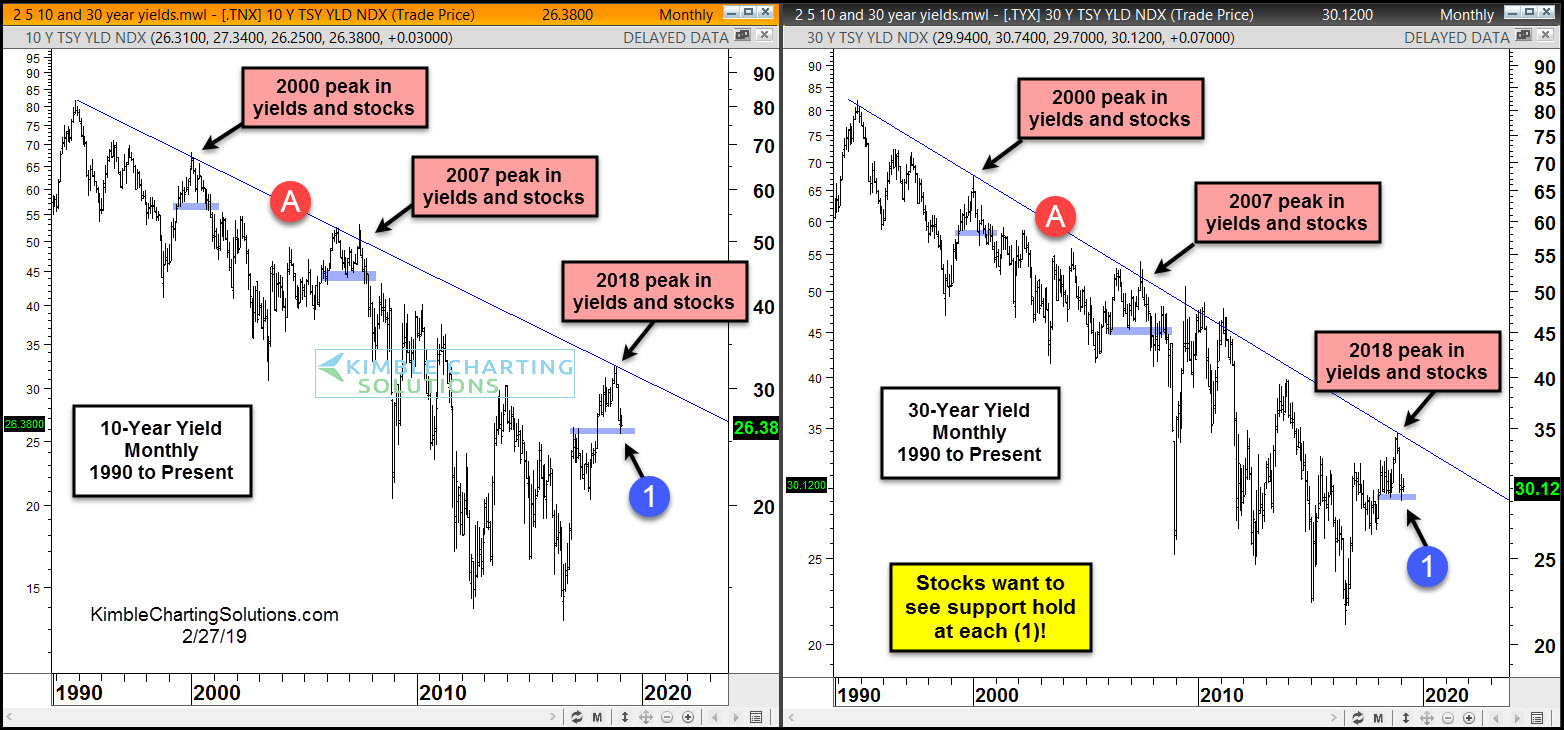
But more recently, the news has been focused on the prospects of a yield curve inversion and how that correlates to economic slowdowns/recessions. Today, we are going to simply look at the 10-Year and 30-Year US Treasury Yield charts.
In my business, a picture (chart) is worth a 1000 words.
Over the past 3 decades, Treasury yields have been in a downtrend, with major stock tops (and treasury yield tops) coming in 2000 and 2007.
Will 2018-2019 be the same? From a pattern standpoint, stock market bulls hope the reversal lower in Treasury yields finds support soon… preferably at point (1)! Stay tuned!
This post was originally was written for See It Markets.com. To see original article CLICK HERE
–
