
The Federal Reserve wasn’t quite as hawkish as investors expected. The result: Treasury bond yields (interest rates) fell sharply.
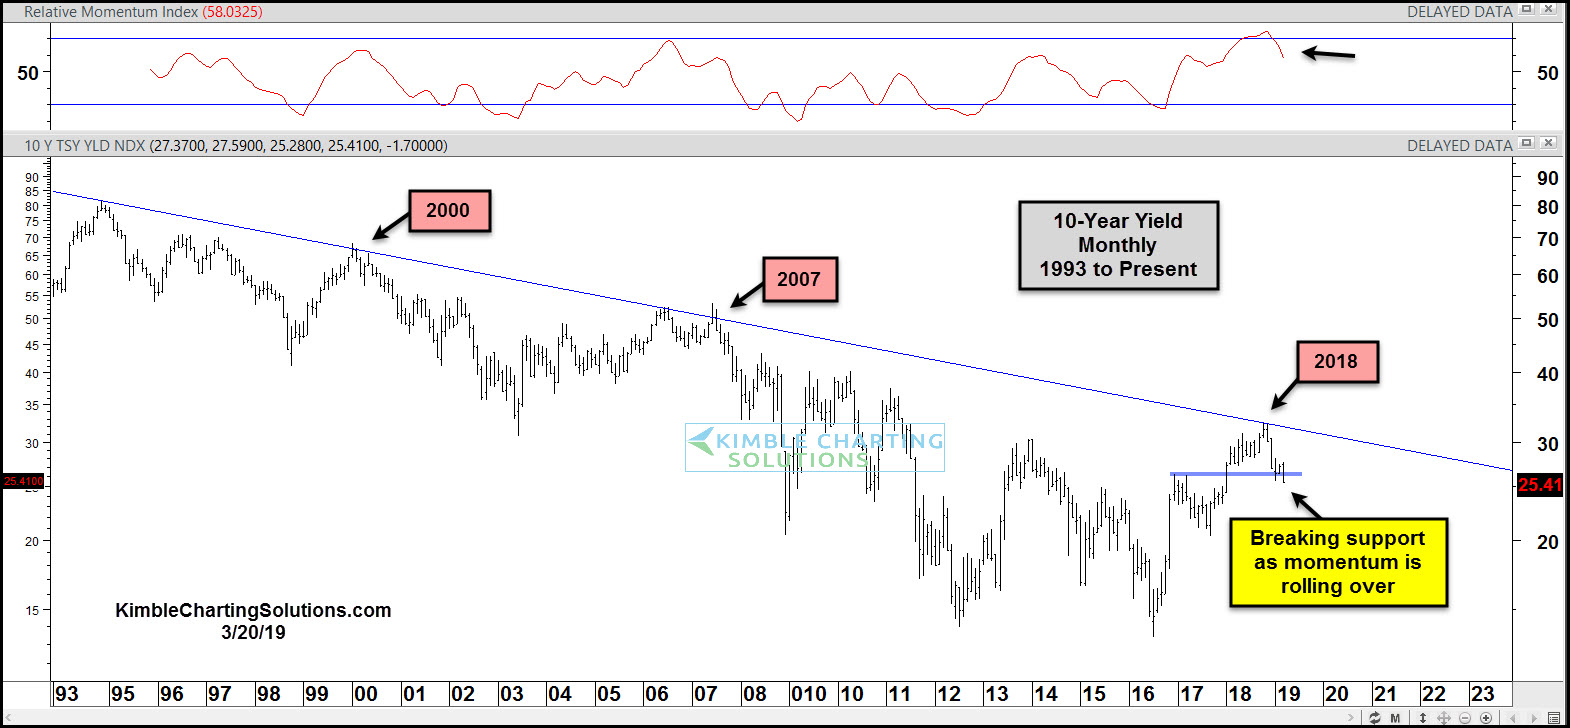
In today’s chart of the 10-Year US Treasury Yield, we highlight the reversal in rates that occurred late last year.
This wasn’t just any old reversal, though. It occurred along the same long-term downtrend line that produced reversals in the years 2000 and 2007.
A closer look at the chart and it appears that 10-year yields are breaking short-term support. This is also occurring as monthly momentum rolls over from lofty levels
Interest rates can provide insight into the economy long before pundits begin reporting on it. Could the recent decline in interest rates be a signal that the economy is beginning to sputter? At a minimum, it’s worth watching! Stay tuned!
This article was first written for See It Markets.com. To see original post CLICK HERE
–
